HOT TOPICS LIST
- MACD
- Fibonacci
- RSI
- Gann
- ADXR
- Stochastics
- Volume
- Triangles
- Futures
- Cycles
- Volatility
- ZIGZAG
- MESA
- Retracement
- Aroon
INDICATORS LIST
LIST OF TOPICS
PRINT THIS ARTICLE
by Billy Williams
The best of times, the worst of times: 2010 in review and the key to profiting in 2011.
Position: Hold
Billy Williams
Billy Williams has been trading the markets for 27 years, specializing in momentum trading with stocks and options.
PRINT THIS ARTICLE
STOCKS
2010 In Review
01/05/11 08:26:19 AMby Billy Williams
The best of times, the worst of times: 2010 in review and the key to profiting in 2011.
Position: Hold
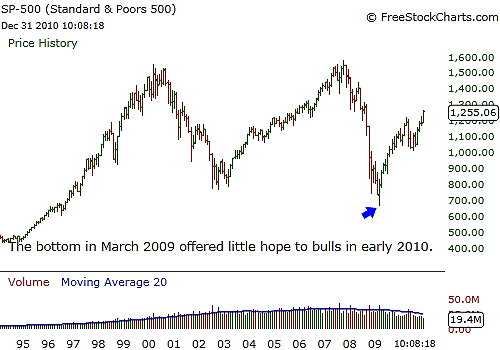
| "It was the best of times, it was the worst of times" -- that quote from Charles Dickens' novel, "The Tale Of Two Cities," seems appropriate for 2010. It was a rough year, with the lowest bottom seen in almost 15 years still in the rear-view mirror of 2009, falling even further than the dotcom bubble in the late 1990s; 2010 didn't seem to offer any reprieve from the bears. Worse, there seemed to be no bottom in sight as massive selloffs of 1% or more were commonplace in the Dow Jones Industrial Average (DJIA), along with the economic data getting worse with each passing week. Yet, despite the horrible environment, there was an abundance of opportunities starting much earlier than many would admit, starting in February. In early 2010, the market found its legs after showing high readings on the volatility index (VIX) showing that extreme levels in selling had reached a pinnacle, which was followed by a "O'Neil Follow Thru Day." This confirmed the bottom where the market rallied high up until April. In April 2010, the bears took control of the market again, forcing it down on negative news on the debt contagion that was spreading to Greece, followed by Portugal. With the debt crisis at a white-hot fever pitch, Europe intervened but not before fear swept through the market with a vengeance, resulting in massive selloffs. Worse, in the US, the private sector sat on a staggering $2 trillion worth of capital due to doubts as to what the future held. Banks followed this line of thinking, opting for US Treasuries, taking advantage of the spread from the low-rates offered by the Fed and also sitting on an estimated $1 trillion of capital rather lending it in an unsure business environment. See Figure 1. |

|
| FIGURE 1: S&P 500. Things looked bleak going into 2010 but by studying price action versus listening to opinions, you could have caught the bull run in 2010. |
| Graphic provided by: www.freestockcharts.com. |
| |
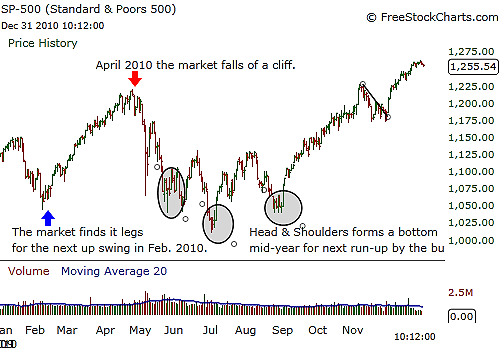
| The Fed continued to print money, taking the dollar from a global base currency supply of around $825 billion to a mind-blowing $2.4 trillion, diluting the dollar's strength while trying to keep itself afloat. The logic will certainly be debated by pundits and armchair economists in the years to come but, for now, it appeared to form a bottom in the markets. Still, much of the overinflated real estate inventories are still left on the books rather than liquidated and, at some point, that will have to be dealt with. In midyear 2010, the market vacillated, forming an inverse head & shoulders pattern and revealing a bottom had formed, staging the runup for the bulls to take the market higher into the end of the year. See Figure 2 |

|
| FIGURE 2: S&P 500. The S&P zigzagged through the year but revealed where the tops gave warnings to get out as well as where the bottoms formed to get back in. |
| Graphic provided by: www.freestockcharts.com. |
| |
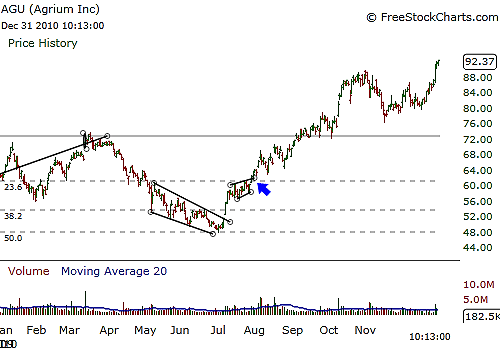
| Watching the market's price action helped you pick winning stock positions in stocks that had a leadership role in the market, helping take it higher. For example, Agrium Inc. mirrored the Standard & Poor's 500 from February to March 2010, declining to a low on July 1. The Fibonacci retracements showed the stock retracing to the 0.50 February retracement at the same time the S&P formed an inverse head & shoulders pattern, which then clued you in that AGU could come back strong, which it did. See Figure 3. |

|
| FIGURE 3: AGU. AGU moved in step with the larger market and by following the clues, you profited handsomely from this 30-point move in AGU that would have yielded a 50% gain that even Paul Tudor Jones would be proud of! |
| Graphic provided by: www.freestockcharts.com. |
| |
| At the end of July, Agrium broke through a consolidating price channel, exploding upward and gaining almost 50%, or 30 points since the entry was signaled. |

|
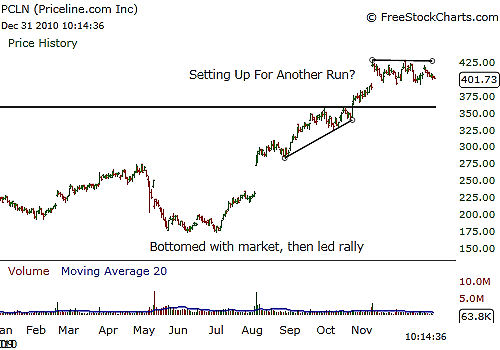
| FIGURE 4: PCLN. PCLN was another stock leader that took the S&P higher with an incredible 200-point move and the promise of going higher as we head into 2011. |
| Graphic provided by: www.freestockcharts.com. |
| |
| Priceline is another leadership stock that moved in tandem with the larger S&P index, declining from its April highs, finding its bottom and then exploding in early August while gaining an incredible 200 points from that gap move. After an exhaustion gap in November, Priceline retreated in price and has been consolidating but, as of late, had been firming up in its price action. This could indicate that it is preparing for another leg up if it trades up through its old resistance level at former price highs. See Figure 4. Every market has sectors of strength and weakness; both can be exploited if one has the right amount of skill and will to trade such moves. The year 2010 had its challenges, but those who continued to hone their craft were able to come out of such a year as better traders and, hopefully, profited as well. This year, 2011, will offer the same or more opportunities for those who have the discipline to study price action, control risk, and strengthen their discipline in the development of skill to trade and the will to act or not as their trading rules dictate. |
Billy Williams has been trading the markets for 27 years, specializing in momentum trading with stocks and options.
| Company: | StockOptionSystem.com |
| E-mail address: | stockoptionsystem.com@gmail.com |
Traders' Resource Links | |
| StockOptionSystem.com has not added any product or service information to TRADERS' RESOURCE. | |
Click here for more information about our publications!
Comments
Date: 01/11/11Rank: 4Comment:

Request Information From Our Sponsors
- StockCharts.com, Inc.
- Candle Patterns
- Candlestick Charting Explained
- Intermarket Technical Analysis
- John Murphy on Chart Analysis
- John Murphy's Chart Pattern Recognition
- John Murphy's Market Message
- MurphyExplainsMarketAnalysis-Intermarket Analysis
- MurphyExplainsMarketAnalysis-Visual Analysis
- StockCharts.com
- Technical Analysis of the Financial Markets
- The Visual Investor
- VectorVest, Inc.
- Executive Premier Workshop
- One-Day Options Course
- OptionsPro
- Retirement Income Workshop
- Sure-Fire Trading Systems (VectorVest, Inc.)
- Trading as a Business Workshop
- VectorVest 7 EOD
- VectorVest 7 RealTime/IntraDay
- VectorVest AutoTester
- VectorVest Educational Services
- VectorVest OnLine
- VectorVest Options Analyzer
- VectorVest ProGraphics v6.0
- VectorVest ProTrader 7
- VectorVest RealTime Derby Tool
- VectorVest Simulator
- VectorVest Variator
- VectorVest Watchdog
