HOT TOPICS LIST
- MACD
- Fibonacci
- RSI
- Gann
- ADXR
- Stochastics
- Volume
- Triangles
- Futures
- Cycles
- Volatility
- ZIGZAG
- MESA
- Retracement
- Aroon
INDICATORS LIST
LIST OF TOPICS
PRINT THIS ARTICLE
by Billy Williams
One of the biggest edges you can give yourself is knowing who the strongest stock leaders are and how to spot them.
Position: Hold
Billy Williams
Billy Williams has been trading the markets for 27 years, specializing in momentum trading with stocks and options.
PRINT THIS ARTICLE
STOCKS
Stock Hit List And Sizing Up The Market
01/03/11 02:18:16 PMby Billy Williams
One of the biggest edges you can give yourself is knowing who the strongest stock leaders are and how to spot them.
Position: Hold
| The markets are ever dynamic in that they are made up of competing forces that are paradox in nature: buying versus selling, expansion versus contraction, fundamentals versus technicals, and strength versus weakness. It's these paradoxical forces that do battle in differing degrees each trading day and the lone trader, like a fighter pilot, must navigate his way through all these competing dynamics in order to prosper. One of the cornerstones of successful trading therefore are being able to size up each of the competing factors and develop a battle plan. There are a lot of different factors that we must consider, especially which segments are the strongest in order to find the next leaders in the stock market who will serve as the "tip of the spear," taking the market's price action to new highs, and the weakest segments will lag the market's price action and, if given the opportunity, will take the market down in value. The challenge to take under consideration is when the market is under transition, meaning that stocks that were deemed leaders in the context of the present trend are now shifting roles where emerging stocks are now gathering strength and gaining momentum that could take the market higher supplanting yesterday's leaders. Just as a group of runners in a track relay team will pass the baton to the next sprinter, stock leadership passes the baton to the new group of leaders in the stock market's dynamic, offering the opportunity for higher gains with new opportunities and avoiding losses by taking profits at the appropriate time. This is the natural ebb and flow that exists with the study of price action and, for the professional speculator, the opportunity to spot profitable stocks within the context of the trend. |

|
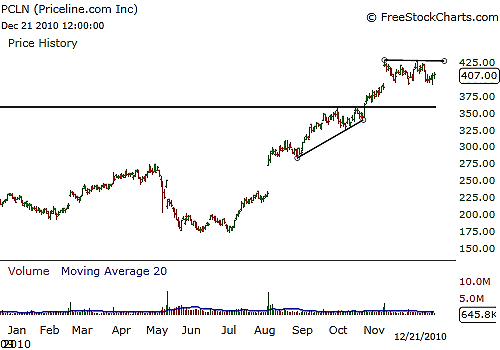
| FIGURE 1: PCLN. PCLN is setting up after consolidating its gains from a strong bull run and possibly emerging as a leader again. |
| Graphic provided by: www.freestockcharts.com. |
| |
| As of now, as we head into 2011, the overall market is in a bull run as the December effect seems to have been in full strength. The December effect is a pattern that takes hold as the fund managers begin to make a run on the market, taking it higher by doing so, with the opportunity to inflate the gains on their respective funds. This running the market higher swells the gains on their funds, helping them qualify for performance bonuses so there is an incentive for them to do so, resulting in this pattern with regularity each year at this time. Recently, it appears that the market is shifting leadership among stocks as Priceline is setting up to take a leadership role again (Figure 1). Priceline (PCLN) had been a very strong bull run but pulled back, giving doubt as if it would resume its role and begin to decline. Now, it appears that Priceline was consolidating its gains and is likely to trade higher, taking the market higher. |

|
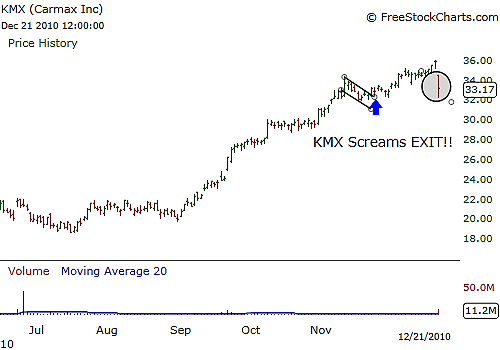
| FIGURE 2: KMX. KMX had a strong role in the last leg of the previous bull run, but recent price action signals that this stock may be stepping aside in that role for now. |
| Graphic provided by: www.freestockcharts.com. |
| |
| Carmax (KMX) (Figure 2), unfortunately, is now giving strong exit signals and looks as if it will step back from its role as a leader in this market for now. A dealer in used cars, it has been a strong earner as many car shoppers as the current economy has made many price conscious, opting for quality used cars versus new. The current price action may reflect that many buyers have a more optimistic view on the future, looking for new models as the economy may be improving. |

|
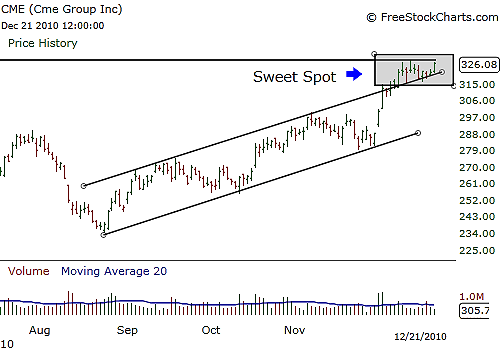
| FIGURE 3: CME. CME is showing renewed strength as it climbs higher with the strong likelihood that if it gets past this critical price level, it will be a key player in 2011. |
| Graphic provided by: www.freestockcharts.com. |
| |
| Chicago Mercantile Exchange (CME) seems to be the dark horse that may be a strong earner in 2011 (Figure 3). A strong company with horrible price action except for the bears but now has begun to slowly climb higher, showing strong with each lead of its ascent. Commodities are going to be worth watching in 2011 as the Fed keeps printing money and causing inflation fears, which may result in raw resources becoming more valuable and possibly putting this stock at the forefront of the next bull run. It's important to keep an eye on current and former stock leaders as the market moves forward because weakness in one typically results in another taking the lead. When stocks act weak in a strong market, that is a strong indicator that new leadership may be under way. Spotting them early on will give you an edge by taking advantage in this shift in strength, swelling your trading account with profits gained by knowing where to trade before anyone else. |
Billy Williams has been trading the markets for 27 years, specializing in momentum trading with stocks and options.
| Company: | StockOptionSystem.com |
| E-mail address: | stockoptionsystem.com@gmail.com |
Traders' Resource Links | |
| StockOptionSystem.com has not added any product or service information to TRADERS' RESOURCE. | |
Click here for more information about our publications!
Comments
Date: 01/04/11Rank: 3Comment:

|

Request Information From Our Sponsors
- StockCharts.com, Inc.
- Candle Patterns
- Candlestick Charting Explained
- Intermarket Technical Analysis
- John Murphy on Chart Analysis
- John Murphy's Chart Pattern Recognition
- John Murphy's Market Message
- MurphyExplainsMarketAnalysis-Intermarket Analysis
- MurphyExplainsMarketAnalysis-Visual Analysis
- StockCharts.com
- Technical Analysis of the Financial Markets
- The Visual Investor
- VectorVest, Inc.
- Executive Premier Workshop
- One-Day Options Course
- OptionsPro
- Retirement Income Workshop
- Sure-Fire Trading Systems (VectorVest, Inc.)
- Trading as a Business Workshop
- VectorVest 7 EOD
- VectorVest 7 RealTime/IntraDay
- VectorVest AutoTester
- VectorVest Educational Services
- VectorVest OnLine
- VectorVest Options Analyzer
- VectorVest ProGraphics v6.0
- VectorVest ProTrader 7
- VectorVest RealTime Derby Tool
- VectorVest Simulator
- VectorVest Variator
- VectorVest Watchdog
