HOT TOPICS LIST
- MACD
- Fibonacci
- RSI
- Gann
- ADXR
- Stochastics
- Volume
- Triangles
- Futures
- Cycles
- Volatility
- ZIGZAG
- MESA
- Retracement
- Aroon
INDICATORS LIST
LIST OF TOPICS
PRINT THIS ARTICLE
by Koos van der Merwe
With the Obama health plan coming into play in spite of opposition, is it worthwhile to invest in pharmaceutical companies?
Position: Accumulate
Koos van der Merwe
Has been a technical analyst since 1969, and has worked as a futures and options trader with First Financial Futures in Johannesburg, South Africa.
PRINT THIS ARTICLE
ELLIOTT WAVE
Pfizer Laboratories Worth The Play?
01/03/11 11:44:33 AMby Koos van der Merwe
With the Obama health plan coming into play in spite of opposition, is it worthwhile to invest in pharmaceutical companies?
Position: Accumulate
| Pharmaceutical companies need money for research so they can find new drugs to treat diseases, especially when patents on existing drugs start expiring. That is why drug prices are high. Generic companies like TEVA profit when patents expire. Without doing any research they score well with sales of a cheaper product that has proved highly effective. In Canada, which has a social medical aid system, when a doctor prescribes a drug for a patient, the pharmacy has the right to substitute a generic, unless the doctor specifically states on the prescription that he wants the original dispensed. With the United States moving in the direction of a socialized medical aid system, the same generic substitution will occur. This is the reason why the large drug companies spent millions in their attempts to kill the Obama health care system. Keeping this in mind, we must ask, "Is it worth buying pharmaceutical companies?" The market thinks it is. |

|
| FIGURE 1: PFE, MONTHLY |
| Graphic provided by: AdvancedGET. |
| |
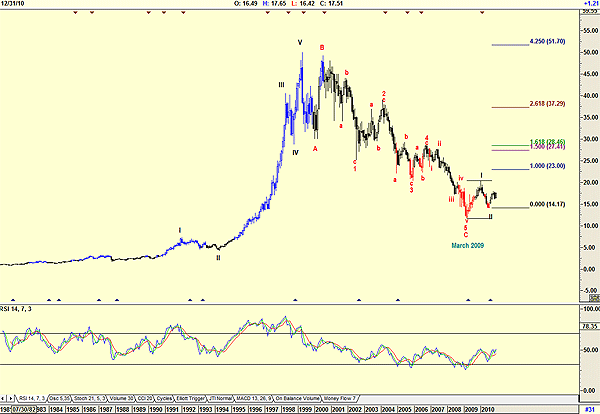
| Figure 1, a monthly chart of Pfizer Labs, shows that Wave C bottomed in a classical Elliott wave count in March 2009. Since then the share has completed a Wave 1 and a Wave 2 of a new bull trend, with Wave 3 projected at the minimum to $23 as shown by the Fibonacci projections. The bull trend is confirmed by the relative strength index (RSI), which is rising. |

|
| FIGURE 2: PFE, DAILY |
| Graphic provided by: AdvancedGET. |
| |
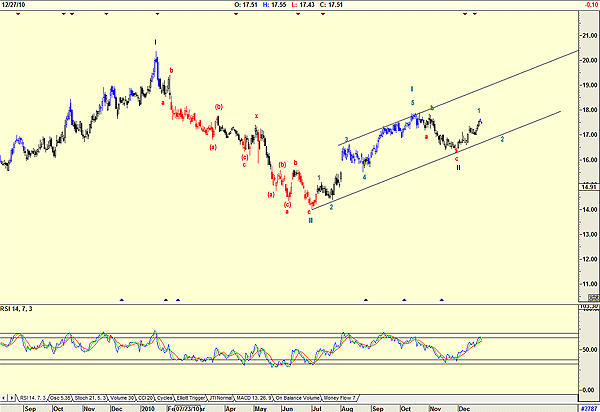
| Figure 2, a daily chart, shows a more detailed count of the Elliott wave count, and because its RSI is approaching overbought levels, we could see a wave 2 correction of Wave III appearing in the near future. |

|
| FIGURE 3: PFE, WEEKLY |
| Graphic provided by: OmniTrader. |
| |
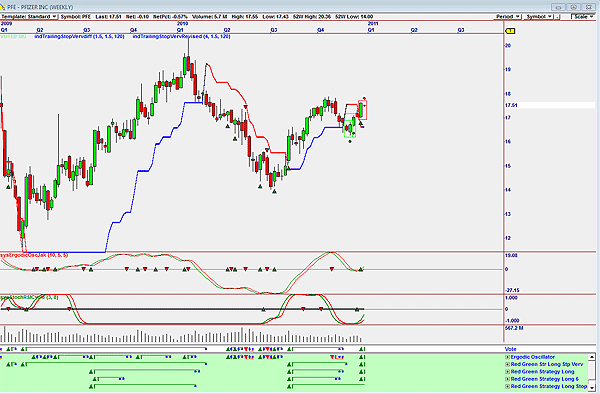
| Figure 3 is a weekly OmniTrader chart. I have chosen a weekly chart rather than a daily one because of the wave 2 correction expected, as suggested by the wave count. A weekly chart is a long-term chart that should be used by investors. The chart is suggesting a buy at present levels. This suggests that the wave 1 top suggested on the daily chart of Figure 2 still has upside to it. Note that both the ergodic oscillator and stochastic RSI Cycle indicator are both suggesting strength. I would be a buyer of Pfizer Labs at present levels but would keep my trailing stock close. Or I would wait for the correction and buy as the stock corrects into Wave 2 of Wave III. Definitely a share on my watchlist. |
Has been a technical analyst since 1969, and has worked as a futures and options trader with First Financial Futures in Johannesburg, South Africa.
| Address: | 3256 West 24th Ave |
| Vancouver, BC | |
| Phone # for sales: | 6042634214 |
| E-mail address: | petroosp@gmail.com |
Click here for more information about our publications!
PRINT THIS ARTICLE

Request Information From Our Sponsors
- VectorVest, Inc.
- Executive Premier Workshop
- One-Day Options Course
- OptionsPro
- Retirement Income Workshop
- Sure-Fire Trading Systems (VectorVest, Inc.)
- Trading as a Business Workshop
- VectorVest 7 EOD
- VectorVest 7 RealTime/IntraDay
- VectorVest AutoTester
- VectorVest Educational Services
- VectorVest OnLine
- VectorVest Options Analyzer
- VectorVest ProGraphics v6.0
- VectorVest ProTrader 7
- VectorVest RealTime Derby Tool
- VectorVest Simulator
- VectorVest Variator
- VectorVest Watchdog
- StockCharts.com, Inc.
- Candle Patterns
- Candlestick Charting Explained
- Intermarket Technical Analysis
- John Murphy on Chart Analysis
- John Murphy's Chart Pattern Recognition
- John Murphy's Market Message
- MurphyExplainsMarketAnalysis-Intermarket Analysis
- MurphyExplainsMarketAnalysis-Visual Analysis
- StockCharts.com
- Technical Analysis of the Financial Markets
- The Visual Investor
