HOT TOPICS LIST
- MACD
- Fibonacci
- RSI
- Gann
- ADXR
- Stochastics
- Volume
- Triangles
- Futures
- Cycles
- Volatility
- ZIGZAG
- MESA
- Retracement
- Aroon
INDICATORS LIST
LIST OF TOPICS
PRINT THIS ARTICLE
by Mike Carr, CMT
Oil has hit resistance levels near $90 a barrel, while unleaded gas futures have recently pushed through resistance but also faces challenges to a sustained bull run.
Position: N/A
Mike Carr, CMT
Mike Carr, CMT, is a member of the Market Technicians Association, and editor of the MTA's newsletter, Technically Speaking. He is also the author of "Smarter Investing in Any Economy: The Definitive Guide to Relative Strength Investing," and "Conquering the Divide: How to Use Economic Indicators to Catch Stock Market Trends."
PRINT THIS ARTICLE
RATE CHANGE - PRICE
Unleaded Gas Quietly Surging
01/03/11 09:49:46 AMby Mike Carr, CMT
Oil has hit resistance levels near $90 a barrel, while unleaded gas futures have recently pushed through resistance but also faces challenges to a sustained bull run.
Position: N/A
| Unleaded gas is a fairly liquid market, even though its open interest is only about 20% as large as the crude oil contract. With open interest greater than 225,000 contracts all year, it is a market that individuals can trade in, but as with all futures markets, limit orders can help prevent bad fills. |
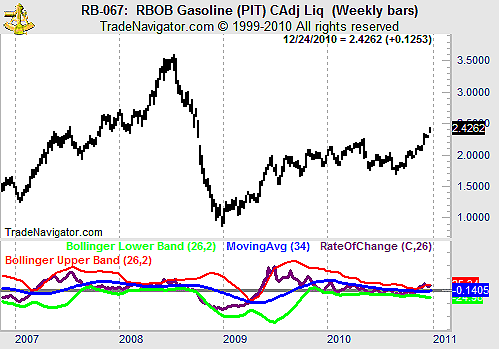
| Price is nearing $2.45 a gallon, after clearing resistance near $2.15 that had constrained advances for more than two years. The futures contract has surged more than 40% since its August lows, more than twice the gain of crude oil. The rapid advance has pushed the rate of change (ROC) indicator into overbought territory (Figure 1). |

|
| FIGURE 1: GASOLINE, WEEKLY. The weekly chart of gasoline futures shows a market that should be of interest to traders. |
| Graphic provided by: Trade Navigator. |
| |
| In Figure 1, ROC is placed between Bollinger bands to help define highs and lows. Another benefit of looking at indicators within Bollinger bands is that low volatility often leads to highly volatile periods. The indicator became overbought after volatility contracted, indicating a breakout is possible. Previous instances when this occurred have at times led to consolidations in unleaded gas. |
| One concern in the market is that commercial traders have established a sizable short position in mid-December 2010. Commercial traders are widely believed to be right more often than they are wrong in futures markets, and going long when commercials are short is a bet against the traders who likely know the most about the market fundamentals. |
| Seasonal trends show a tendency to bottom in February. Short-term weakness now could present a buying opportunity. Watching the action of the commercials could provide a timing signal. |
Mike Carr, CMT, is a member of the Market Technicians Association, and editor of the MTA's newsletter, Technically Speaking. He is also the author of "Smarter Investing in Any Economy: The Definitive Guide to Relative Strength Investing," and "Conquering the Divide: How to Use Economic Indicators to Catch Stock Market Trends."
| Website: | www.moneynews.com/blogs/MichaelCarr/id-73 |
| E-mail address: | marketstrategist@gmail.com |
Click here for more information about our publications!
Comments
Date: 01/04/11Rank: 5Comment:

Request Information From Our Sponsors
- StockCharts.com, Inc.
- Candle Patterns
- Candlestick Charting Explained
- Intermarket Technical Analysis
- John Murphy on Chart Analysis
- John Murphy's Chart Pattern Recognition
- John Murphy's Market Message
- MurphyExplainsMarketAnalysis-Intermarket Analysis
- MurphyExplainsMarketAnalysis-Visual Analysis
- StockCharts.com
- Technical Analysis of the Financial Markets
- The Visual Investor
- VectorVest, Inc.
- Executive Premier Workshop
- One-Day Options Course
- OptionsPro
- Retirement Income Workshop
- Sure-Fire Trading Systems (VectorVest, Inc.)
- Trading as a Business Workshop
- VectorVest 7 EOD
- VectorVest 7 RealTime/IntraDay
- VectorVest AutoTester
- VectorVest Educational Services
- VectorVest OnLine
- VectorVest Options Analyzer
- VectorVest ProGraphics v6.0
- VectorVest ProTrader 7
- VectorVest RealTime Derby Tool
- VectorVest Simulator
- VectorVest Variator
- VectorVest Watchdog
