HOT TOPICS LIST
- MACD
- Fibonacci
- RSI
- Gann
- ADXR
- Stochastics
- Volume
- Triangles
- Futures
- Cycles
- Volatility
- ZIGZAG
- MESA
- Retracement
- Aroon
INDICATORS LIST
LIST OF TOPICS
PRINT THIS ARTICLE
by Koos van der Merwe
With the price of oil rising almost every day, one should be wary of investing in oil companies, yet the price of oil keeps rising offering opportunities.
Position: Buy
Koos van der Merwe
Has been a technical analyst since 1969, and has worked as a futures and options trader with First Financial Futures in Johannesburg, South Africa.
PRINT THIS ARTICLE
OSCILLATORS
Oil Play With Schlumberger
01/03/11 09:32:29 AMby Koos van der Merwe
With the price of oil rising almost every day, one should be wary of investing in oil companies, yet the price of oil keeps rising offering opportunities.
Position: Buy
| Schlumberger Ltd. is the leading oil field services provider for oil and gas companies around the world. Its common stock is listed on the New York Stock Exchange under the symbol SLB, and on the Paris, London, Amsterdam, and the Bourse Electronique Swiss stock exchanges. The company invests significant time and money on research and development to support and grow. Since March 1966, the company's shares have split 10 times, suggesting that long-term growth is its forte. |

|
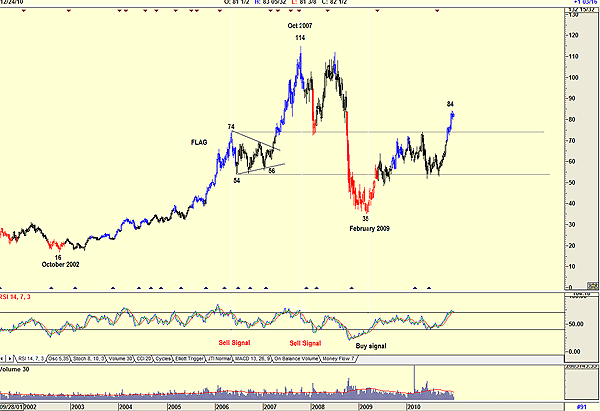
| FIGURE 1: SCHLUMBERGER, WEEKLY |
| Graphic provided by: AdvancedGET. |
| |
| Figure 1, a weekly chart, shows how the share price rose from a low of $16 in October 2002 to a high of $114 by October 2007. Note the flag pattern shown on the chart, which correctly forecast the target of $114 (74 - 16 = 58 + 56 = 114). Note also how the price fell to the support level of $54, the lowest level in the flag, with the upper level of the flag, $74 acting as a strong resistance level. The relative strength index (RSI) also performed well, giving divergence sell signals as well as a correct buy signal. At the moment, as you can see on the chart, the RSI is overbought, but a sell signal has not been given. |

|
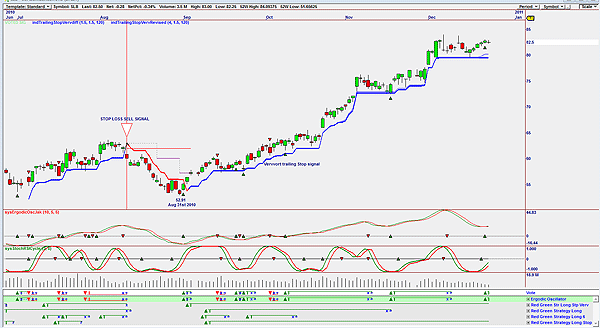
| FIGURE 2: SCHLUMBERGER, DAILY |
| Graphic provided by: Omnitrader.. |
| |
| Figure 2 is a daily chart and shows how the share price has strengthened from a low of $52.91 on August 31, 2010, to its present price of $82.50. Note how the vote line, a summation of the various red green strategies plus the ergodic oscillator has accurately given previous buy and sell signals. At present, the vote line has given a buy signal. I would be a buyer of Schlumberger at the present price, but not for a long-term hold. The weekly chart shows the RSI at overbought levels. Because of this, I would possibly tighten my trailing stop and keep a very close eye on the ergodic oscillator for a sell signal. |
Has been a technical analyst since 1969, and has worked as a futures and options trader with First Financial Futures in Johannesburg, South Africa.
| Address: | 3256 West 24th Ave |
| Vancouver, BC | |
| Phone # for sales: | 6042634214 |
| E-mail address: | petroosp@gmail.com |
Click here for more information about our publications!
Comments

Request Information From Our Sponsors
- StockCharts.com, Inc.
- Candle Patterns
- Candlestick Charting Explained
- Intermarket Technical Analysis
- John Murphy on Chart Analysis
- John Murphy's Chart Pattern Recognition
- John Murphy's Market Message
- MurphyExplainsMarketAnalysis-Intermarket Analysis
- MurphyExplainsMarketAnalysis-Visual Analysis
- StockCharts.com
- Technical Analysis of the Financial Markets
- The Visual Investor
- VectorVest, Inc.
- Executive Premier Workshop
- One-Day Options Course
- OptionsPro
- Retirement Income Workshop
- Sure-Fire Trading Systems (VectorVest, Inc.)
- Trading as a Business Workshop
- VectorVest 7 EOD
- VectorVest 7 RealTime/IntraDay
- VectorVest AutoTester
- VectorVest Educational Services
- VectorVest OnLine
- VectorVest Options Analyzer
- VectorVest ProGraphics v6.0
- VectorVest ProTrader 7
- VectorVest RealTime Derby Tool
- VectorVest Simulator
- VectorVest Variator
- VectorVest Watchdog
