HOT TOPICS LIST
- MACD
- Fibonacci
- RSI
- Gann
- ADXR
- Stochastics
- Volume
- Triangles
- Futures
- Cycles
- Volatility
- ZIGZAG
- MESA
- Retracement
- Aroon
INDICATORS LIST
LIST OF TOPICS
PRINT THIS ARTICLE
by Mike Carr, CMT
Bond prices are in the news, a few weeks ago as a bubble and now as a crash. The rate of change indicator helps evaluate these claims.
Position: N/A
Mike Carr, CMT
Mike Carr, CMT, is a member of the Market Technicians Association, and editor of the MTA's newsletter, Technically Speaking. He is also the author of "Smarter Investing in Any Economy: The Definitive Guide to Relative Strength Investing," and "Conquering the Divide: How to Use Economic Indicators to Catch Stock Market Trends."
PRINT THIS ARTICLE
RATE CHANGE - PRICE
Bonds Bouncing Between Extremes
01/03/11 09:24:46 AMby Mike Carr, CMT
Bond prices are in the news, a few weeks ago as a bubble and now as a crash. The rate of change indicator helps evaluate these claims.
Position: N/A
| The 10-year US Treasury futures contract serves as a proxy for bond prices in the minds of many traders. Prices rose nearly 15% from the beginning of 2010 into the November high. Moves like this are rarely associated with bubbles in the minds of traders. But traders are usually more concerned with how to profit from a move rather than what to call a price move. |
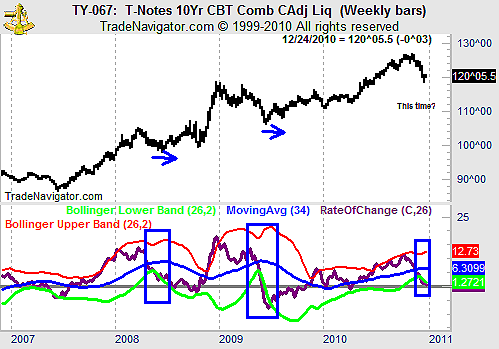
| The rate of change (ROC) indicator can help a trader see when prices have moved too far, too fast. While the percentage change in bonds was certainly not at bubble-like levels, the ROC showed that the upward move was certainly powerful and worth watching. In Figure 1, we show price, along with a 26-week ROC, and we add Bollinger bands to the indicator. |

|
| FIGURE 1: 10-YEAR TREASURY NOTE, WEEKLY. ROC can help spot unusually rapid price moves, as highlighted in this weekly chart of the 10-year Treasury contract. |
| Graphic provided by: Trade Navigator. |
| |
| The chart highlights that the ROC fell below its lower Bollinger band, once in 2008 and once in 2009. Both times marked intermediate-term bottoms in price. Interestingly, touches and breaks of the upper band have been associated with both continuations and consolidations, offering no real indication for traders. |
| We certainly don't know if the bond selloff is over. But ROC is telling us that we need to be watching for a potential consolidation. While prices are not showing extremes, the ROC is, and that is one indicator that traders could benefit from watching. |
Mike Carr, CMT, is a member of the Market Technicians Association, and editor of the MTA's newsletter, Technically Speaking. He is also the author of "Smarter Investing in Any Economy: The Definitive Guide to Relative Strength Investing," and "Conquering the Divide: How to Use Economic Indicators to Catch Stock Market Trends."
| Website: | www.moneynews.com/blogs/MichaelCarr/id-73 |
| E-mail address: | marketstrategist@gmail.com |
Click here for more information about our publications!
Comments
Date: 01/04/11Rank: 4Comment:

Request Information From Our Sponsors
- VectorVest, Inc.
- Executive Premier Workshop
- One-Day Options Course
- OptionsPro
- Retirement Income Workshop
- Sure-Fire Trading Systems (VectorVest, Inc.)
- Trading as a Business Workshop
- VectorVest 7 EOD
- VectorVest 7 RealTime/IntraDay
- VectorVest AutoTester
- VectorVest Educational Services
- VectorVest OnLine
- VectorVest Options Analyzer
- VectorVest ProGraphics v6.0
- VectorVest ProTrader 7
- VectorVest RealTime Derby Tool
- VectorVest Simulator
- VectorVest Variator
- VectorVest Watchdog
- StockCharts.com, Inc.
- Candle Patterns
- Candlestick Charting Explained
- Intermarket Technical Analysis
- John Murphy on Chart Analysis
- John Murphy's Chart Pattern Recognition
- John Murphy's Market Message
- MurphyExplainsMarketAnalysis-Intermarket Analysis
- MurphyExplainsMarketAnalysis-Visual Analysis
- StockCharts.com
- Technical Analysis of the Financial Markets
- The Visual Investor
