HOT TOPICS LIST
- MACD
- Fibonacci
- RSI
- Gann
- ADXR
- Stochastics
- Volume
- Triangles
- Futures
- Cycles
- Volatility
- ZIGZAG
- MESA
- Retracement
- Aroon
INDICATORS LIST
LIST OF TOPICS
PRINT THIS ARTICLE
by Koos van der Merwe
Is Cypress giving us a peek into the immediate future?
Position: Buy
Koos van der Merwe
Has been a technical analyst since 1969, and has worked as a futures and options trader with First Financial Futures in Johannesburg, South Africa.
PRINT THIS ARTICLE
ELLIOTT WAVE
Cypress Semiconductor
12/20/10 01:09:41 PMby Koos van der Merwe
Is Cypress giving us a peek into the immediate future?
Position: Buy
| Recent trading in the market suggests that a Christmas rally is happening. The problem is that my wave charts are suggesting that the wave could be a fifth wave, leading to a wave IV that could take a number of months (see my previous articles). |

|
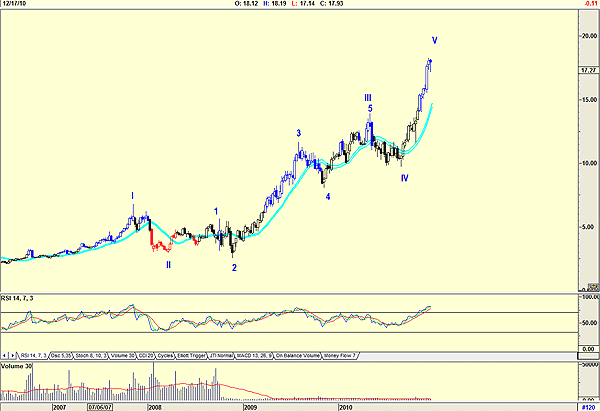
| FIGURE 1: CY, WEEKLY. Here's the Elliott wave count. |
| Graphic provided by: AdvancedGET. |
| |
| Figure 1, a weekly chart of Cypress, is very disturbing, because it suggests that the share is the final stages of an Elliott wave V. This is confirmed by the relative strength index (RSI) 14-period indicator, which is at overbought levels. What is also disturbing is how trading volume per week fell from strong volume when the share price was at the $5.00 level to the present very weak volume as the price rose from late 2008. |

|
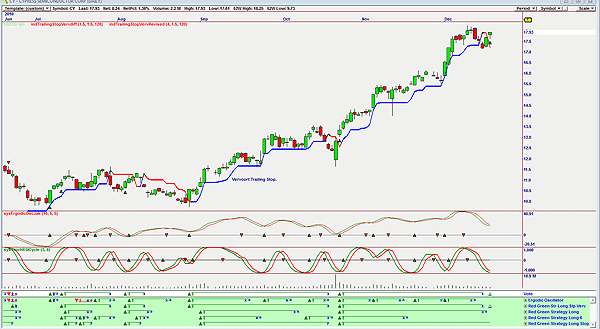
| FIGURE 2: CY, DAILY. Here's a short-term buy signal. |
| Graphic provided by: OmniTrader. |
| |
| Figure 2 is a daily chart suggesting a buy signal. This is surprising when we think of the weekly chart in Figure 1 that is suggesting a fifth wave top in the making. The strategy I am using is the red green strategy with variations. This strategy is where the closing price is greater than the low of six days ago. The variations in the strategy use different stop levels, but the trailing stop shown on the chart is the Vervoort trailing stop. Do note the ergodic oscillator and the stochastic relative strength oscillator (RSO), both close to giving buy signals. By eyeballing the chart and the vote line, you can see how well the strategy worked. I would buy the share at the current price, but I would always keep in mind that this could be because of the usual Santa Claus rally. If you decide to buy, just realize that it is a short-term hold. Once the Santa rally is over, look for a sell -- a break below the trailing stop or a sell by the ergodic oscillator. |
Has been a technical analyst since 1969, and has worked as a futures and options trader with First Financial Futures in Johannesburg, South Africa.
| Address: | 3256 West 24th Ave |
| Vancouver, BC | |
| Phone # for sales: | 6042634214 |
| E-mail address: | petroosp@gmail.com |
Click here for more information about our publications!
Comments
Date: 12/21/10Rank: 5Comment: Koos:
Merry Christmas!
Dick Slayton

Request Information From Our Sponsors
- StockCharts.com, Inc.
- Candle Patterns
- Candlestick Charting Explained
- Intermarket Technical Analysis
- John Murphy on Chart Analysis
- John Murphy's Chart Pattern Recognition
- John Murphy's Market Message
- MurphyExplainsMarketAnalysis-Intermarket Analysis
- MurphyExplainsMarketAnalysis-Visual Analysis
- StockCharts.com
- Technical Analysis of the Financial Markets
- The Visual Investor
- VectorVest, Inc.
- Executive Premier Workshop
- One-Day Options Course
- OptionsPro
- Retirement Income Workshop
- Sure-Fire Trading Systems (VectorVest, Inc.)
- Trading as a Business Workshop
- VectorVest 7 EOD
- VectorVest 7 RealTime/IntraDay
- VectorVest AutoTester
- VectorVest Educational Services
- VectorVest OnLine
- VectorVest Options Analyzer
- VectorVest ProGraphics v6.0
- VectorVest ProTrader 7
- VectorVest RealTime Derby Tool
- VectorVest Simulator
- VectorVest Variator
- VectorVest Watchdog
