HOT TOPICS LIST
- MACD
- Fibonacci
- RSI
- Gann
- ADXR
- Stochastics
- Volume
- Triangles
- Futures
- Cycles
- Volatility
- ZIGZAG
- MESA
- Retracement
- Aroon
INDICATORS LIST
LIST OF TOPICS
PRINT THIS ARTICLE
by Koos van der Merwe
Here's one of the many examples of successfully using the JM internal band strategy.
Position: Buy
Koos van der Merwe
Has been a technical analyst since 1969, and has worked as a futures and options trader with First Financial Futures in Johannesburg, South Africa.
PRINT THIS ARTICLE
MOVING AVERAGES
Tesoro Corp.
12/20/10 09:08:12 AMby Koos van der Merwe
Here's one of the many examples of successfully using the JM internal band strategy.
Position: Buy
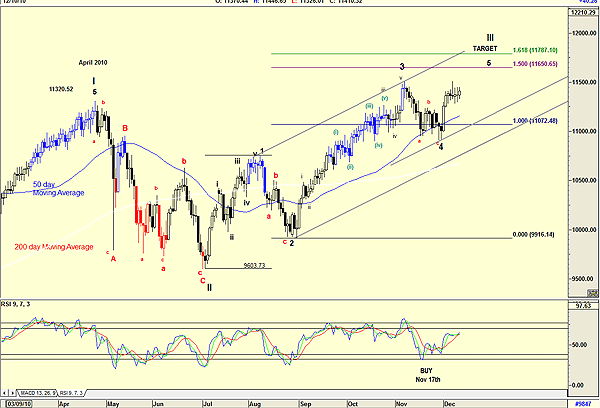
| In the December 2010 issue of STOCKS & COMMODITIES, I wrote an article called "Less Stress With The JM Internal Band." I stressed that it is a trading strategy that helps you sleep and prepares you for the market the following morning. This article is a variation of that strategy. Instead of buying when the closing price breaks above the upper band, more adventurous risk takers should buy when the closing price breaks above the lower band and go short when it falls below the upper band. A position will be closed depending on your preferred stop-loss strategy. The formula seen below is a 2% variation above and below a 15-period simple moving average. |

|
| FIGURE 1: TESORO, DAILY |
| Graphic provided by: AdvancedGET. |
| |
| Figure 1 is a daily chart of Tesoro Corp. (TSO) and shows the following: Just eyeballing the chart with its buy and sell signals shows you that the strategy is profitable. The chart shows two buy failures shown out of 10 buy signals given, with two short signal failures out of seven shorts given. Not a bad return. At the moment the share has given a buy signal, even though the relative strength index (RSI) has turned negative. The volume is above average at the moment. This is a strategy that should be used as one of the arrows in your quiver. Whereas the original strategy suggests that you buy when close breaks the upper band, and short when it falls below the lower band, the strategy suggested here is for the more adventurous. |
Has been a technical analyst since 1969, and has worked as a futures and options trader with First Financial Futures in Johannesburg, South Africa.
| Address: | 3256 West 24th Ave |
| Vancouver, BC | |
| Phone # for sales: | 6042634214 |
| E-mail address: | petroosp@gmail.com |
Click here for more information about our publications!
PRINT THIS ARTICLE

Request Information From Our Sponsors
- StockCharts.com, Inc.
- Candle Patterns
- Candlestick Charting Explained
- Intermarket Technical Analysis
- John Murphy on Chart Analysis
- John Murphy's Chart Pattern Recognition
- John Murphy's Market Message
- MurphyExplainsMarketAnalysis-Intermarket Analysis
- MurphyExplainsMarketAnalysis-Visual Analysis
- StockCharts.com
- Technical Analysis of the Financial Markets
- The Visual Investor
- VectorVest, Inc.
- Executive Premier Workshop
- One-Day Options Course
- OptionsPro
- Retirement Income Workshop
- Sure-Fire Trading Systems (VectorVest, Inc.)
- Trading as a Business Workshop
- VectorVest 7 EOD
- VectorVest 7 RealTime/IntraDay
- VectorVest AutoTester
- VectorVest Educational Services
- VectorVest OnLine
- VectorVest Options Analyzer
- VectorVest ProGraphics v6.0
- VectorVest ProTrader 7
- VectorVest RealTime Derby Tool
- VectorVest Simulator
- VectorVest Variator
- VectorVest Watchdog
