HOT TOPICS LIST
- MACD
- Fibonacci
- RSI
- Gann
- ADXR
- Stochastics
- Volume
- Triangles
- Futures
- Cycles
- Volatility
- ZIGZAG
- MESA
- Retracement
- Aroon
INDICATORS LIST
LIST OF TOPICS
PRINT THIS ARTICLE
by Donald W. Pendergast, Jr.
Triple-bottom setups within the context of a major consolidation pattern may offer short-sale opportunities for patient traders.
Position: N/A
Donald W. Pendergast, Jr.
Donald W. Pendergast is a financial markets consultant who offers specialized services to stock brokers and high net worth individuals who seek a better bottom line for their portfolios.
PRINT THIS ARTICLE
TRITOP/TRI BOTTOM
Radio Shack Possible Short Setup
12/17/10 08:32:36 AMby Donald W. Pendergast, Jr.
Triple-bottom setups within the context of a major consolidation pattern may offer short-sale opportunities for patient traders.
Position: N/A
| Just like many other stocks in the Standard & Poor's 500, shares of Radio Shack Corp. (RSH) have also enjoyed substantial gains since last summer. Now, however, the stock looks vulnerable as a very large weekly consolidation pattern approaches the moment of truth. |

|
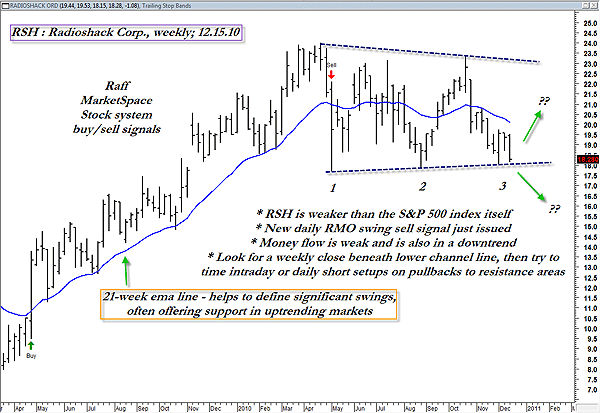
| FIGURE 1: RSH, WEEKLY. Breakout coming up -- or a bounce back higher? In the stock market anything can happen, but a confirmed weekly close below the lower blue channel line might lend itself to some good shorting opportunities for daily and intraday traders. |
| Graphic provided by: MetaStock. |
| |
| Typically, consolidation patterns that form after a large rise in the price of a stock are thought to be just a resting place where the stock can digest the gains before drawing in fresh buying power for continued movement higher. In the case of Figure 1, this weekly chart for RSH, however, we need to do a little extra digging to unearth the true nature of this pattern. First off, money flows have gone negative, which is not a good sign for a stock thought to be in an uptrend. Second, the stock has poor relative strength versus the S&P 500 -- definitely not on a momentum trader's shopping list for big gains in early 2001. Next, witness the potential triple-bottom sell breakout pattern (marked as 1-2-3); the weekly swing lows are in the same general price range ($17.70 to $18.04), while the swing highs are actually in a falling mode. Given this basic information, the line of least resistance for RSH appears to be toward lower prices, at least for the next few weeks. The stock has just fired an RMO swing sell signal on its daily chart, so there's another bit of bias toward lower prices, too. |
| Playing a potential breakdown out of the pattern might go something like this: If you see RSH make a weekly close below that lower dashed blue channel line, drill down to either the daily chart or even a 30- to 60-minute chart and start looking for pullbacks to key resistance areas such as floor trader pivots, major intraday trendlines, moving averages, and Fibonacci confluence areas. Once you get a nice pullback to say, the 21- or 50-period exponential moving average (EMA) on a 30- or 60-minute chart, you may want to get ready to go short the stock, knowing that the dominant trend direction on the weekly time frame is already moving RSH lower. Once in a short trade, look to exit at the first logical support zone and don't get too greedy -- any intraday short setup that offers a risk-to-reward ratio of around 2 to 1 might be a good starting point to help you plan and plot your short trading regimen. |
| December is normally bullish for the broad US markets, but for those stocks that are already lagging the market, that seasonal bias isn't likely to have the same effect as it does on the top performers, anyway. Watch this setup over the next few weeks and see if the breakdown occurs as anticipated. You may want to simply paper-trade the various intraday short setups that manifest after a sharp break lower on the weekly chart. It could and should be a very rewarding learning experience. |
Donald W. Pendergast is a financial markets consultant who offers specialized services to stock brokers and high net worth individuals who seek a better bottom line for their portfolios.
| Title: | Writer, market consultant |
| Company: | Linear Trading Systems LLC |
| Jacksonville, FL 32217 | |
| Phone # for sales: | 904-239-9564 |
| E-mail address: | lineartradingsys@gmail.com |
Traders' Resource Links | |
| Linear Trading Systems LLC has not added any product or service information to TRADERS' RESOURCE. | |
Click here for more information about our publications!
Comments
Date: 12/21/10Rank: 4Comment:

Request Information From Our Sponsors
- StockCharts.com, Inc.
- Candle Patterns
- Candlestick Charting Explained
- Intermarket Technical Analysis
- John Murphy on Chart Analysis
- John Murphy's Chart Pattern Recognition
- John Murphy's Market Message
- MurphyExplainsMarketAnalysis-Intermarket Analysis
- MurphyExplainsMarketAnalysis-Visual Analysis
- StockCharts.com
- Technical Analysis of the Financial Markets
- The Visual Investor
- VectorVest, Inc.
- Executive Premier Workshop
- One-Day Options Course
- OptionsPro
- Retirement Income Workshop
- Sure-Fire Trading Systems (VectorVest, Inc.)
- Trading as a Business Workshop
- VectorVest 7 EOD
- VectorVest 7 RealTime/IntraDay
- VectorVest AutoTester
- VectorVest Educational Services
- VectorVest OnLine
- VectorVest Options Analyzer
- VectorVest ProGraphics v6.0
- VectorVest ProTrader 7
- VectorVest RealTime Derby Tool
- VectorVest Simulator
- VectorVest Variator
- VectorVest Watchdog
