HOT TOPICS LIST
- MACD
- Fibonacci
- RSI
- Gann
- ADXR
- Stochastics
- Volume
- Triangles
- Futures
- Cycles
- Volatility
- ZIGZAG
- MESA
- Retracement
- Aroon
INDICATORS LIST
LIST OF TOPICS
PRINT THIS ARTICLE
by Mike Carr, CMT
While investors can use technical analysis to help spot breakouts and evaluate risk, they should still understand what they are investing in, as the Market Vectors Vietnam ETF demonstrates.
Position: N/A
Mike Carr, CMT
Mike Carr, CMT, is a member of the Market Technicians Association, and editor of the MTA's newsletter, Technically Speaking. He is also the author of "Smarter Investing in Any Economy: The Definitive Guide to Relative Strength Investing," and "Conquering the Divide: How to Use Economic Indicators to Catch Stock Market Trends."
PRINT THIS ARTICLE
DATA
Know Your ETF
12/16/10 08:35:27 AMby Mike Carr, CMT
While investors can use technical analysis to help spot breakouts and evaluate risk, they should still understand what they are investing in, as the Market Vectors Vietnam ETF demonstrates.
Position: N/A
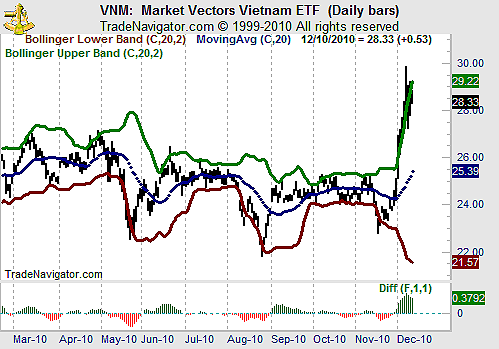
| In the first days of December 2010, Market Vectors Vietnam ETF (VNM) broke out to new highs. Figure 1 shows a bullish technical picture. Prices went from an oversold extreme, below the lower Bollinger band, and through the 20-day moving average with a confirmation from the MACD and several other indicators (not shown). |

|
| FIGURE 1: VNM, DAILY. The breakout in early December is easy to spot in hindsight. |
| Graphic provided by: Trade Navigator. |
| |
| A look at Google News finds the usual type of analysis. Many experts cite solid economic growth, with GDP estimated to show 6.5% to 7% growth in 2011. The country is also working with Japan to develop rare earth mining projects, a development probably spurred by China's reduction of exports of these metals to Japan. As an alternative source for the raw materials of many electronic devices, Vietnam must certainly be in a long-term bull market, according to these analysts. |
| A few analysts dug deeper and used an overlooked indicator to spot a potential problem. ETFs generally trade very close to the underlying value of their holdings, just like a mutual fund. For example, on December 10, the SPDR S&P 500 (SPY) closed at 124.48, a 0.5% premium to the actual basket of stocks that make up the index. If these values diverge, arbitragers will move in and capture a riskless profit. |
| For VNM, that premium was 15.3% at Friday's close. This information is available from sites such as Yahoo! Finance, where the symbol is VNM-NV. There are reports that Vietnam has restricted the flow of capital, and the ETF is no longer trading in line with the underlying value of its holdings. The technical buy signal is caused by a shift in the regulatory environment and represents an arbitrage opportunity rather than a shift in investor sentiment. |
| Traders can profit from this but should know what they are trading. Understanding that this move is due to a shift in the premium, traders may prefer to go short, expecting it to narrow. Traders like to believe they can trade solely from charts, but with ETFs, it is important to understand what's in them and how they track those underlying holdings. It can mean the difference between winning and losing. |
Mike Carr, CMT, is a member of the Market Technicians Association, and editor of the MTA's newsletter, Technically Speaking. He is also the author of "Smarter Investing in Any Economy: The Definitive Guide to Relative Strength Investing," and "Conquering the Divide: How to Use Economic Indicators to Catch Stock Market Trends."
| Website: | www.moneynews.com/blogs/MichaelCarr/id-73 |
| E-mail address: | marketstrategist@gmail.com |
Click here for more information about our publications!
PRINT THIS ARTICLE

Request Information From Our Sponsors
- VectorVest, Inc.
- Executive Premier Workshop
- One-Day Options Course
- OptionsPro
- Retirement Income Workshop
- Sure-Fire Trading Systems (VectorVest, Inc.)
- Trading as a Business Workshop
- VectorVest 7 EOD
- VectorVest 7 RealTime/IntraDay
- VectorVest AutoTester
- VectorVest Educational Services
- VectorVest OnLine
- VectorVest Options Analyzer
- VectorVest ProGraphics v6.0
- VectorVest ProTrader 7
- VectorVest RealTime Derby Tool
- VectorVest Simulator
- VectorVest Variator
- VectorVest Watchdog
- StockCharts.com, Inc.
- Candle Patterns
- Candlestick Charting Explained
- Intermarket Technical Analysis
- John Murphy on Chart Analysis
- John Murphy's Chart Pattern Recognition
- John Murphy's Market Message
- MurphyExplainsMarketAnalysis-Intermarket Analysis
- MurphyExplainsMarketAnalysis-Visual Analysis
- StockCharts.com
- Technical Analysis of the Financial Markets
- The Visual Investor
