HOT TOPICS LIST
- MACD
- Fibonacci
- RSI
- Gann
- ADXR
- Stochastics
- Volume
- Triangles
- Futures
- Cycles
- Volatility
- ZIGZAG
- MESA
- Retracement
- Aroon
INDICATORS LIST
LIST OF TOPICS
PRINT THIS ARTICLE
by Donald W. Pendergast, Jr.
Keltner bands are a great trading tool, and when used with other technical indicators, they can help you better anticipate likely reversal and support/resistance zones.
Position: N/A
Donald W. Pendergast, Jr.
Donald W. Pendergast is a financial markets consultant who offers specialized services to stock brokers and high net worth individuals who seek a better bottom line for their portfolios.
PRINT THIS ARTICLE
KELTNER CHANNELS
Mighty Russell Near Resistance/Reversal Zone
12/15/10 08:46:31 AMby Donald W. Pendergast, Jr.
Keltner bands are a great trading tool, and when used with other technical indicators, they can help you better anticipate likely reversal and support/resistance zones.
Position: N/A
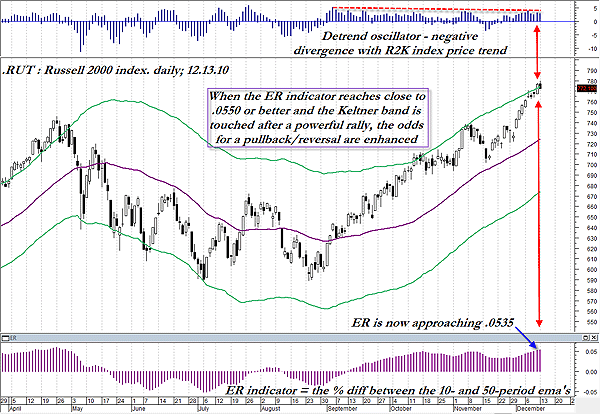
| The Russell 2000 index (R2K) has run up by about 190 points in three and a half months (about 31%) and may yet again be giving meaningful signs of trend exhaustion to alert traders and investors. Figure 1 is a closer look, using the daily chart of the index. |

|
| FIGURE 1: RUT, DAILY. Picking exact tops is crazy, but when three different technical tools agree that price is in the neighborhood for a reversal lower, wise traders and investors will want to take closer look to protect existing long positions. |
| Graphic provided by: MetaStock. |
| Graphic provided by: WB Detrend RT EOD from ProfitTrader for MetaStock. |
| |
| Normally, in the Russell 2000, a Keltner band set at about 4.00 to 4.50 average true ranges (ATRs) away from a 45-period exponential moving average (EMA) will tend to contain 90% of the index's price action; the other 10% of the time, the price will tend to oscillate between the inner band and an outer band set approximately 6.5 to 7.5 ATRs away from the same 45-period EMA. Timing reversal trades after extreme (bullish or bearish) movement to such an outer band (not shown) is usually simpler to execute (and typically gives faster results in many cases), but you can also use the smaller bands to help you decide if a stock, index, or commodity is approaching a likely reversal zone. |
| So, that said, here's the scene; the R2K appears to be close to the termination of not only the smaller (but very powerful) thrust higher from the mid-November pullback, but also the gargantuan run higher since August 2010. The reasons are three-fold: 1. This is the third interaction with the Keltner band since the big rally began. On the two prior tags, the pullbacks were measurable, and the index spent very little time outside the band before reversing lower. Now, with a third tag under way with even more bearish divergences evident, the pullback could be swift and sharp. 2. With the index again challenging this statistically strong Keltner resistance area, we also need to note that the detrend oscillator (top of chart) is also revealing a slow but sure pattern of negative divergences, meaning that the oscillator is failing to make higher indicator cycle highs along with the price of the index itself. 3. Finally, look at the EMA ratio (ER) indicator at the bottom of the chart. This simply measures the percentage in difference between the 10-period EMA and the 50-period EMA. On the daily graph of the R2K, tradable reversals seem to occur when the ER gets close to the 0.0550 area (that's 5.5% difference between the two averages) at around the same time that prices are at/near the Keltner band. Taken altogether, the image appears to be warning of a fairly good-sized correction to follow. It may not happen this week, or even the next, but once the bullish seasonal factor wears off after New Year's Day, all of the major US indexes (and commodity markets) may decide it's the perfect time to cruise down to lower price levels, perhaps before launching to even higher prices in the second half of 2011. |
Donald W. Pendergast is a financial markets consultant who offers specialized services to stock brokers and high net worth individuals who seek a better bottom line for their portfolios.
| Title: | Writer, market consultant |
| Company: | Linear Trading Systems LLC |
| Jacksonville, FL 32217 | |
| Phone # for sales: | 904-239-9564 |
| E-mail address: | lineartradingsys@gmail.com |
Traders' Resource Links | |
| Linear Trading Systems LLC has not added any product or service information to TRADERS' RESOURCE. | |
Click here for more information about our publications!
Comments
Date: 12/21/10Rank: 5Comment:

Request Information From Our Sponsors
- VectorVest, Inc.
- Executive Premier Workshop
- One-Day Options Course
- OptionsPro
- Retirement Income Workshop
- Sure-Fire Trading Systems (VectorVest, Inc.)
- Trading as a Business Workshop
- VectorVest 7 EOD
- VectorVest 7 RealTime/IntraDay
- VectorVest AutoTester
- VectorVest Educational Services
- VectorVest OnLine
- VectorVest Options Analyzer
- VectorVest ProGraphics v6.0
- VectorVest ProTrader 7
- VectorVest RealTime Derby Tool
- VectorVest Simulator
- VectorVest Variator
- VectorVest Watchdog
- StockCharts.com, Inc.
- Candle Patterns
- Candlestick Charting Explained
- Intermarket Technical Analysis
- John Murphy on Chart Analysis
- John Murphy's Chart Pattern Recognition
- John Murphy's Market Message
- MurphyExplainsMarketAnalysis-Intermarket Analysis
- MurphyExplainsMarketAnalysis-Visual Analysis
- StockCharts.com
- Technical Analysis of the Financial Markets
- The Visual Investor
