HOT TOPICS LIST
- MACD
- Fibonacci
- RSI
- Gann
- ADXR
- Stochastics
- Volume
- Triangles
- Futures
- Cycles
- Volatility
- ZIGZAG
- MESA
- Retracement
- Aroon
INDICATORS LIST
LIST OF TOPICS
PRINT THIS ARTICLE
by Koos van der Merwe
Will there be a Xmas rally this year?
Position: Buy
Koos van der Merwe
Has been a technical analyst since 1969, and has worked as a futures and options trader with First Financial Futures in Johannesburg, South Africa.
PRINT THIS ARTICLE
ELLIOTT WAVE
Ho Ho Ho, Is That An Xmas Rally I See?
12/15/10 08:39:35 AMby Koos van der Merwe
Will there be a Xmas rally this year?
Position: Buy
| The Xmas rally is a norm. Consumers spend and overspend over Xmas, and the stock market rallies as the Xmas enthusiasm goes with the flow. |

|
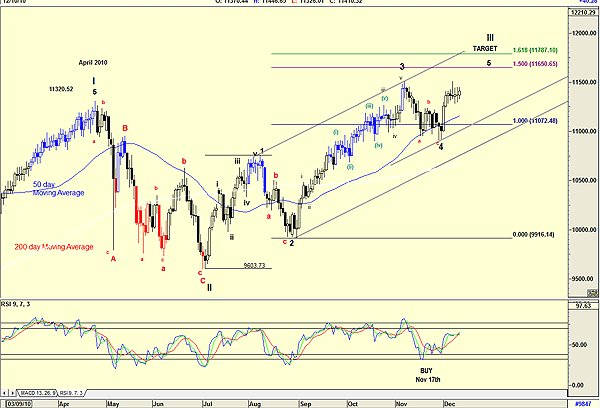
| FIGURE 1: DJIA WITH ELLIOTT WAVE COUNT, DAILY |
| Graphic provided by: AdvancedGET. |
| |
| Figure 1 is a daily chart of the Dow Jones Industrial Average (DJIA) showing my preferred Elliott wave count. This suggests that Wave 5 of Wave III should end at either 11650.65 or 11787.10. The former is the 1.5% target of the Wave 1 of Wave III Fibonacci extension and the latter target is the 1.618% extension. Note how the DJIA hit the 50-day moving average, bounced off it, then fell through it for two days, and recovered. Note also that the relative strength index (RSI), and here I have used a 9-7-3 parameter, gave a buy signal on November 17 and is still showing strength. The wave count on the chart looks right. Nothing fancy, so I will go with it. |

|
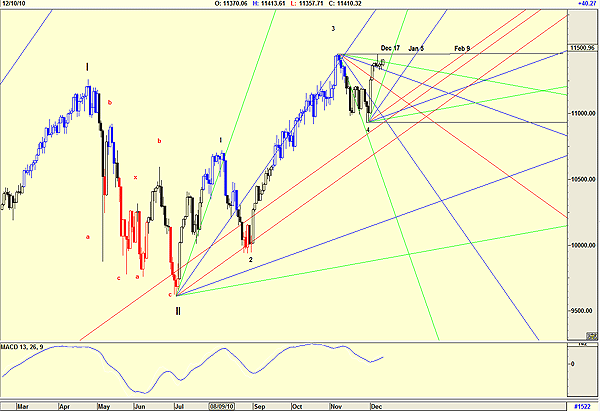
| FIGURE 2: DJIA SHOWING GANN FANS AND TIME, DAILY |
| Graphic provided by: AdvancedGET. |
| |
| Figure 2 shows Gann fans, which are suggesting possible dates that could be the turning point for the targets. Gann fans are drawn from a major low to a high, and then the fan is carried forward to a wave count pivot point. Where the fan crosses a horizontal line drawn from the previous pivot point, a date is shown that should be watched as a possible date for a correction to the trend. Dates shown are December 17, January 5, 2011, and February 9, 2011. Note the moving average convergence/divergence (MACD), which is still showing strength. The DJIA is suggesting that the Xmas rally should continue into December 17 or as late as January 5. The DJIA will then have completed Wave III with a Wave IV correction to follow. The wave should be a simple correction because Wave II was complicated. |
Has been a technical analyst since 1969, and has worked as a futures and options trader with First Financial Futures in Johannesburg, South Africa.
| Address: | 3256 West 24th Ave |
| Vancouver, BC | |
| Phone # for sales: | 6042634214 |
| E-mail address: | petroosp@gmail.com |
Click here for more information about our publications!
PRINT THIS ARTICLE

Request Information From Our Sponsors
- StockCharts.com, Inc.
- Candle Patterns
- Candlestick Charting Explained
- Intermarket Technical Analysis
- John Murphy on Chart Analysis
- John Murphy's Chart Pattern Recognition
- John Murphy's Market Message
- MurphyExplainsMarketAnalysis-Intermarket Analysis
- MurphyExplainsMarketAnalysis-Visual Analysis
- StockCharts.com
- Technical Analysis of the Financial Markets
- The Visual Investor
- VectorVest, Inc.
- Executive Premier Workshop
- One-Day Options Course
- OptionsPro
- Retirement Income Workshop
- Sure-Fire Trading Systems (VectorVest, Inc.)
- Trading as a Business Workshop
- VectorVest 7 EOD
- VectorVest 7 RealTime/IntraDay
- VectorVest AutoTester
- VectorVest Educational Services
- VectorVest OnLine
- VectorVest Options Analyzer
- VectorVest ProGraphics v6.0
- VectorVest ProTrader 7
- VectorVest RealTime Derby Tool
- VectorVest Simulator
- VectorVest Variator
- VectorVest Watchdog
