HOT TOPICS LIST
- MACD
- Fibonacci
- RSI
- Gann
- ADXR
- Stochastics
- Volume
- Triangles
- Futures
- Cycles
- Volatility
- ZIGZAG
- MESA
- Retracement
- Aroon
INDICATORS LIST
LIST OF TOPICS
PRINT THIS ARTICLE
by Tony Jerebic
Here's a look at a few futures contracts that have historic trends in the month of February.
Position: N/A
Tony Jerebic
I developed the strong desire to trade while attending the Northern Alberta Institute of Technology (NAIT). After obtaining my degree in Finance, I obtained a Commerce degree from the University of Alberta and completed the Canadian Futures Exam as well as the Canadian Options Course. From there, I figured the best way to gain that important practical experience was to work directly in the industry. I decided upon working with two of the premier brokerage firms in Canada, keep in mind during this journey I literally read every book and "retail" course I could find! After reviewing hundreds of pages of notes, dozens of books, courses and countless trading strategies, I developed the Futures and Options Made Simple (FOMS)Course.
PRINT THIS ARTICLE
SEASONAL TRADING
Seasonal Trends - Good or Bad?
02/05/02 01:04:18 PMby Tony Jerebic
Here's a look at a few futures contracts that have historic trends in the month of February.
Position: N/A
| Although seasonal trends are a good basis for fundamental analysis, a futures contract is just a short-term investment (days or weeks). A single day's price movement can eat up your entire investment plus some, so try not to let seasonal trends influence your trading too much. However, if seasonal tendencies tell you that corn will decrease at harvest, watch the price chart at harvest for a technical pattern. Seasonal trend charts are for observation only and trades should not be based solely on them. Using these charts along with candle charts makes for an excellent trading system! |
| Seasonal Trends for February |

|
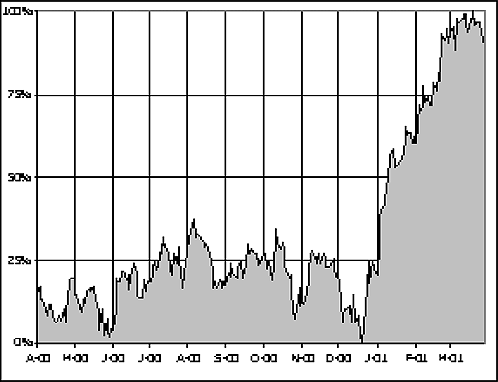
| Figure 1: Seasonal chart for Live Cattle |
| Graphic provided by: www.commodityseasonals.com. |
| |
| Live Cattle has a tendency to rise right from the beginning of January through the first couple of weeks in March. This has been quite reliable this year because prices on the weekly chart broke out above a downward trendline at the beginning of January. Live cattle prices tend toward strength in January through March as transportation routes and the cattle production cycle tend to create a period of limited supply. When the inland barge routes free up from freezing in the spring, grain supplies begin to tighten, and the spring calf population increases, prices usually fall from early March through mid-June. |
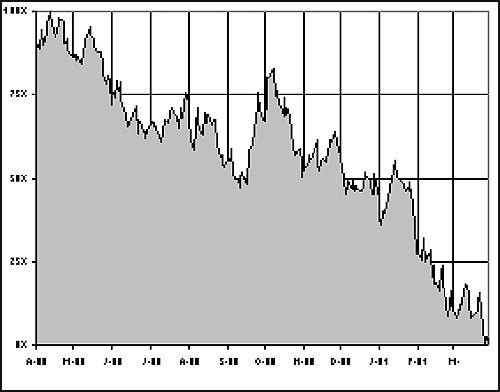
 Figure 2: Seasonal chart for Gold (April 2000-March 01). Gold prices tend to decline from November through the end of February as jewelers reduce their holiday inventory. Over 50% of the demand for gold comes from the jewelry business. With Gold prices in a 15-year downtrend, most of the seasonal analysis points towards lower prices. Watch for technical patterns to short this market. |
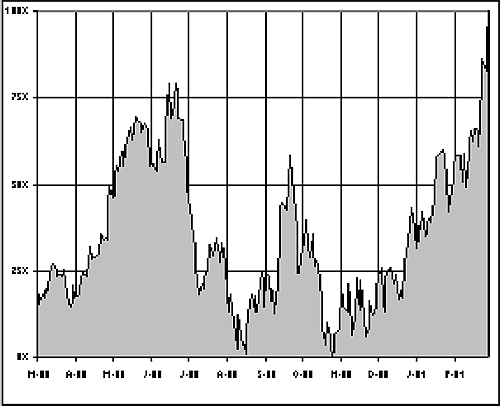
 Figure 3: Seasonal chart for Cotton (March 2000-February 01). Cotton prices, like those of other field crops, tend to move in relation to their production cycle. As such, Cotton prices tend to rally from when fieldwork begins for planting, usually in the middle of February. Prices usually continue to rally up until the crop is pollinated, usually near the tail end of June. Watch for technical patterns for potential long opportunities in February. These observations are based on the seasonal charts provided by www.commodityseasonals.com. These observations are for reference purposes only. Neither the author nor foms.com are liable for any losses that may be incurred as a result of the use of this information. There is risk of loss in trading in the futures market. |
I developed the strong desire to trade while attending the Northern Alberta Institute of Technology (NAIT). After obtaining my degree in Finance, I obtained a Commerce degree from the University of Alberta and completed the Canadian Futures Exam as well as the Canadian Options Course. From there, I figured the best way to gain that important practical experience was to work directly in the industry. I decided upon working with two of the premier brokerage firms in Canada, keep in mind during this journey I literally read every book and "retail" course I could find! After reviewing hundreds of pages of notes, dozens of books, courses and countless trading strategies, I developed the Futures and Options Made Simple (FOMS)Course.
| Company: | F.O.M.S. |
| Phone # for sales: | 800-569-1515 |
| Website: | www.foms.com |
| E-mail address: | info@foms.com |
Traders' Resource Links | |
| F.O.M.S. has not added any product or service information to TRADERS' RESOURCE. | |
Click here for more information about our publications!
Comments
Date: 02/05/02Rank: 3Comment:

Request Information From Our Sponsors
- VectorVest, Inc.
- Executive Premier Workshop
- One-Day Options Course
- OptionsPro
- Retirement Income Workshop
- Sure-Fire Trading Systems (VectorVest, Inc.)
- Trading as a Business Workshop
- VectorVest 7 EOD
- VectorVest 7 RealTime/IntraDay
- VectorVest AutoTester
- VectorVest Educational Services
- VectorVest OnLine
- VectorVest Options Analyzer
- VectorVest ProGraphics v6.0
- VectorVest ProTrader 7
- VectorVest RealTime Derby Tool
- VectorVest Simulator
- VectorVest Variator
- VectorVest Watchdog
- StockCharts.com, Inc.
- Candle Patterns
- Candlestick Charting Explained
- Intermarket Technical Analysis
- John Murphy on Chart Analysis
- John Murphy's Chart Pattern Recognition
- John Murphy's Market Message
- MurphyExplainsMarketAnalysis-Intermarket Analysis
- MurphyExplainsMarketAnalysis-Visual Analysis
- StockCharts.com
- Technical Analysis of the Financial Markets
- The Visual Investor
