HOT TOPICS LIST
- MACD
- Fibonacci
- RSI
- Gann
- ADXR
- Stochastics
- Volume
- Triangles
- Futures
- Cycles
- Volatility
- ZIGZAG
- MESA
- Retracement
- Aroon
INDICATORS LIST
LIST OF TOPICS
PRINT THIS ARTICLE
by Koos van der Merwe
From a high of $57 in 2006, Citigroup fell to a low of $1.22 by March 2009. After that ...
Position: Hold
Koos van der Merwe
Has been a technical analyst since 1969, and has worked as a futures and options trader with First Financial Futures in Johannesburg, South Africa.
PRINT THIS ARTICLE
TREND-CHANNEL
Is Citigroup Worth Buying Now?
12/15/10 02:04:44 PMby Koos van der Merwe
From a high of $57 in 2006, Citigroup fell to a low of $1.22 by March 2009. After that ...
Position: Hold
| We all know what happened with Citigroup. What will happen? The company is dismantling itself, selling off parts of itself all over the world to meet its liabilities and pay back the loan made by the Federal Reserve. The past week saw the US government sell its Citigroup shares on the open market at a very nice profit, and the share price rose even higher. So what now? |

|
| FIGURE 1: CITIGROUP, WEEKLY |
| Graphic provided by: AdvancedGET. |
| |
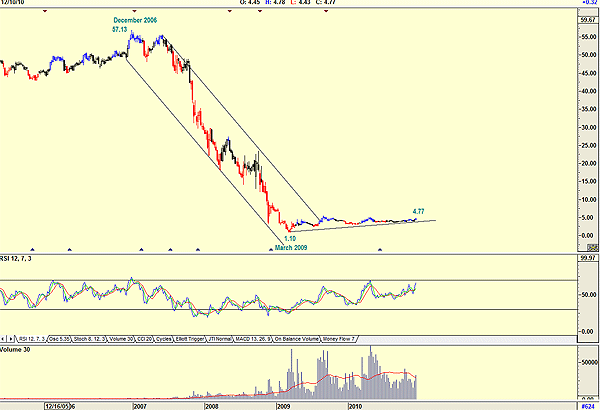
| Figure 1 is a weekly chart and shows how the price fell from $57.23 in December 2006 to a low of $1.10 by March 2009. Its present rise to $4.77 does not look very glamorous, but if you had placed your trust in management, a hard thing to do after the dramatic collapse, you would have reaped a handsome 400% profit. The Chapter 11 bankruptcy of Ambak Financial Group, where shareholders lost everything, is something that could have occurred to Citigroup. |

|
| FIGURE 2: CITIGROUP, DAILY |
| Graphic provided by: OmniTrader. |
| |
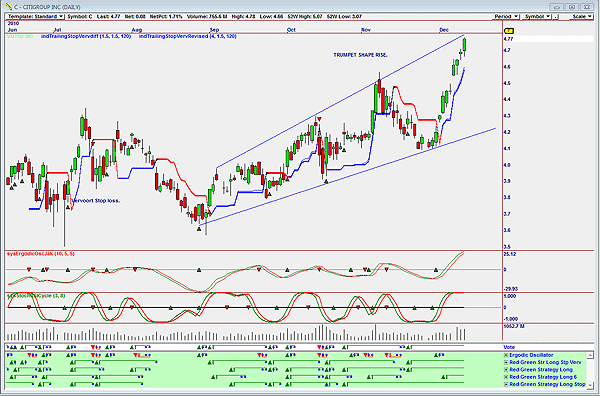
| Figure 2 shows how the price has moved up to present levels from a low of $3.61 in August 2010 to the current high of $4.77. The vote line gave buy signals that were profitable, with the Vervoort trailing stop-loss taking you out of the share, thus allowing you to score well. Although the vote line is suggesting that the share is still a hold, I would be inclined to be a bit nervous, especially with the stochastic relative strength index (RSI) indicator at overbought levels. The ergodic oscillator has not yet given a sell signal, but it does look close to it, and the price is far too close to the upper trendline. If you have the share, hold it, and wait for the sell signal. I would, however, not be a buyer at present levels. |
Has been a technical analyst since 1969, and has worked as a futures and options trader with First Financial Futures in Johannesburg, South Africa.
| Address: | 3256 West 24th Ave |
| Vancouver, BC | |
| Phone # for sales: | 6042634214 |
| E-mail address: | petroosp@gmail.com |
Click here for more information about our publications!
PRINT THIS ARTICLE

Request Information From Our Sponsors
- VectorVest, Inc.
- Executive Premier Workshop
- One-Day Options Course
- OptionsPro
- Retirement Income Workshop
- Sure-Fire Trading Systems (VectorVest, Inc.)
- Trading as a Business Workshop
- VectorVest 7 EOD
- VectorVest 7 RealTime/IntraDay
- VectorVest AutoTester
- VectorVest Educational Services
- VectorVest OnLine
- VectorVest Options Analyzer
- VectorVest ProGraphics v6.0
- VectorVest ProTrader 7
- VectorVest RealTime Derby Tool
- VectorVest Simulator
- VectorVest Variator
- VectorVest Watchdog
- StockCharts.com, Inc.
- Candle Patterns
- Candlestick Charting Explained
- Intermarket Technical Analysis
- John Murphy on Chart Analysis
- John Murphy's Chart Pattern Recognition
- John Murphy's Market Message
- MurphyExplainsMarketAnalysis-Intermarket Analysis
- MurphyExplainsMarketAnalysis-Visual Analysis
- StockCharts.com
- Technical Analysis of the Financial Markets
- The Visual Investor
