HOT TOPICS LIST
- MACD
- Fibonacci
- RSI
- Gann
- ADXR
- Stochastics
- Volume
- Triangles
- Futures
- Cycles
- Volatility
- ZIGZAG
- MESA
- Retracement
- Aroon
INDICATORS LIST
LIST OF TOPICS
PRINT THIS ARTICLE
by Alan R. Northam
Statistical analysis is used to show that the dollar is in an uptrend with an expected price target of 25.
Position: N/A
Alan R. Northam
Alan Northam lives in the Dallas, Texas area and as an electronic engineer gave him an analytical mind from which he has developed a thorough knowledge of stock market technical analysis. His abilities to analyze the future direction of the stock market has allowed him to successfully trade of his own portfolio over the last 30 years. Mr. Northam is now retired and trading the stock market full time. You can reach him at inquiry@tradersclassroom.com or by visiting his website at http://www.tradersclassroom.com. You can also follow him on Twitter @TradersClassrm.
PRINT THIS ARTICLE
LINEAR REG CHANNEL
The Dollar To Move Higher Still
12/10/10 08:49:43 AMby Alan R. Northam
Statistical analysis is used to show that the dollar is in an uptrend with an expected price target of 25.
Position: N/A
| Last month, I used statistical analysis to show that the dollar was in a bottoming process and that a reversal in direction was expected. This month I have again used statistical analysis to show that the US dollar has reversed direction and is now headed higher. In addition, I also use statistical analysis to determine an expected price target. |
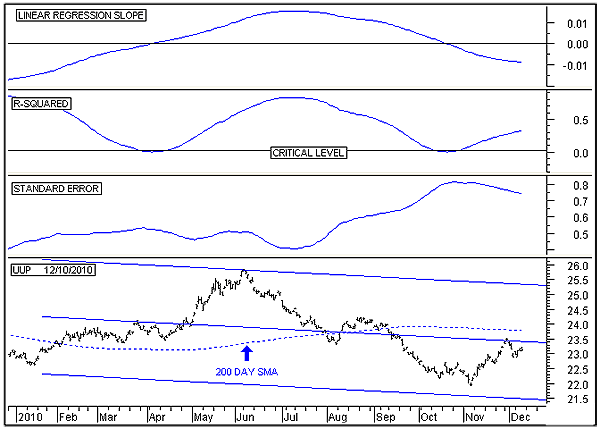
| Figure 1 shows the long-term analysis of the US dollar exchange traded fund (UUP). On the price chart is shown the 200-day linear regression line along with its two standard deviation upper and lower channel lines. Statistically, these two channel lines contain 95% of all trading activity. Thus, a move outside these channel lines would represent a significant change in trading activity and could indicate a change of trend. The middle line is the linear regression trendline and represents the median price of the dollar. A move in price above this line represents overzealous buyers, while a move below represents overzealous sellers. When price moves too far away from the linear regression trendline, it should eventually find its way back to this trendline. Thus, the linear regression trendline acts as a price magnet, attracting price. The standard error indicator is a measure of how far price has wandered from the linear regression line and is also a measure of volatility. Note that from July to November, volatility rose to a very high level. High levels of volatility normally occur at the end of a trend. Thus, volatility is signaling a trend reversal ahead. This is a warning that the long-term downtrend in the dollar could be ready to reverse upward. The linear regression slope indicator is a measure of the current slope of the trend in the dollar. Note that this indicator is below its zero line and continues to point down. This is a signal that the long-term trend in the dollar is still pointing down. The R-squared indicator is a measure of the strength of the trend. When this indicator is pointing upward and is above its critical level, it signals that a strong trend is in place and that there is a 95% probability that it will continue. The long-term analysis shows that the dollar remains in a strong downtrend. As confirmation of this analysis, I have shown that price is below its 200-simple moving average and that this average is also moving down. However, there is also a possibility that the dollar is a lot closer to the end of its downtrend than its beginning, as volatility suggests a major trend reversal ahead. |

|
| FIGURE 1: UUP, DAILY. This chart shows the 200-day linear regression channel on the price chart in the bottom panel, the linear regression slope indicator in the top panel, the R-squared indicator in the second panel, and the standard error indicator in the third. |
| Graphic provided by: MetaStock. |
| |
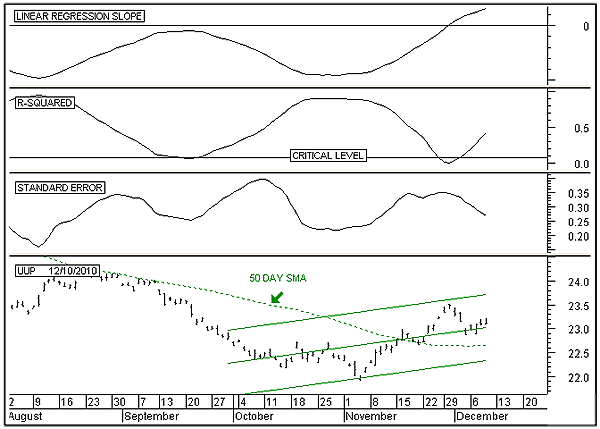
| Note that in Figure 1 the dollar has made a bottom and has recently been moving upward over the last month and is now up against the downsloping linear regression line. Will the linear regression line reverse the dollar back down, or will the dollar continue higher? To help answer this question, I look toward the intermediate-term time frame. In Figure 2, I analyze the intermediate-term trend of the dollar. I have plotted the 50-day linear regression line and its two standard deviation upper and lower channel lines on the price chart. Note that over the last 50 days, the linear regression line has been slanting upward, indicating that the intermediate-term trend is upward. For confirmation, I have also shown the 50-day simple moving average. The standard error indicator is now heading down, indicating that price is becoming less volatile. This suggests that price will now start to follow the linear regression line (middle green line) more closely. The linear regression slope indicator is moving up, indicating that price continues to accelerate upward over the intermediate term. The R-squared indicator is also above its critical level and moving up, indicating the presence of a strong upward intermediate-term trend. Over the intermediate-term trend, the dollar remains in a strong uptrend. Therefore, I would expect price to continue to move higher with a target price at about 25, where price runs into resistance from the 200-day upper channel line. |

|
| FIGURE 2: UUP, DAILY. This chart shows the 50-day linear regression channel on the price chart in the bottom panel, the linear regression slope indicator in the top panel, the R-squared indicator in the second panel, and the standard error indicator in the third. |
| Graphic provided by: MetaStock. |
| |
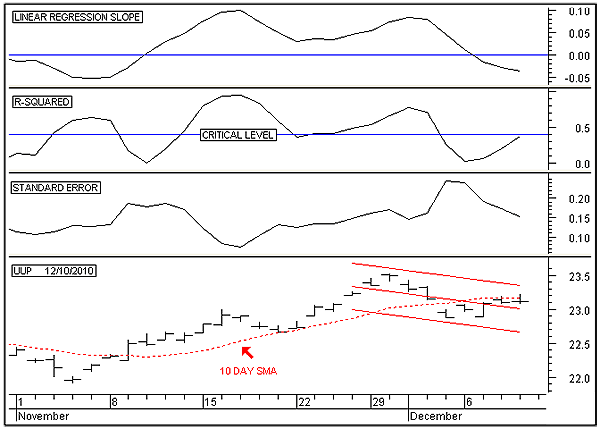
| Figure 3 shows the short-term analysis. Here, I have plotted the 10-day linear regression line and its two standard deviation upper and lower channel lines on the price chart. I see that the linear regression line is pointing down, indicating a short-term correction in the dollar is taking place. I have added the 10-day simple moving average for confirmation. The linear regression slope indicator continues to point down, indicating that price is accelerating down. This tells me that the dollar correction remains in progress. The R-squared indicator also continues to move upward, indicating that correction continues to strengthen. However, this indicator is still below its critical level. If this indicator does not make it above its critical level, then this would suggest that the correction in the dollar is close to completion. However, if the R-squared indicator moves above its critical level, then that would suggest a much deeper correction. The short-term analysis shows that the dollar is currently experiencing a correction to consolidate its recent rise from the November low. |

|
| FIGURE 3: UUP, DAILY. This chart shows the 10-day linear regression channel on the price chart in the bottom panel, the linear regression slope indicator in the top panel, the R-squared indicator in the second panel, and the standard error indicator in the third. |
| Graphic provided by: MetaStock. |
| |
| In conclusion, the dollar remains in a long-term downtrend. However, over the intermediate term, the dollar has been moving in a strengthening upward rally and is headed toward the upper long-term channel line at around 25. Over the short term, however, the dollar is currently experiencing a downward correction. Once this correction has exhausted itself, the upward rally will continue. |
Alan Northam lives in the Dallas, Texas area and as an electronic engineer gave him an analytical mind from which he has developed a thorough knowledge of stock market technical analysis. His abilities to analyze the future direction of the stock market has allowed him to successfully trade of his own portfolio over the last 30 years. Mr. Northam is now retired and trading the stock market full time. You can reach him at inquiry@tradersclassroom.com or by visiting his website at http://www.tradersclassroom.com. You can also follow him on Twitter @TradersClassrm.
| Garland, Tx | |
| Website: | www.tradersclassroom.com |
| E-mail address: | inquiry@tradersclassroom.com |
Click here for more information about our publications!
Comments
Date: 12/14/10Rank: 5Comment:
Date: 12/15/10Rank: 3Comment:

Request Information From Our Sponsors
- StockCharts.com, Inc.
- Candle Patterns
- Candlestick Charting Explained
- Intermarket Technical Analysis
- John Murphy on Chart Analysis
- John Murphy's Chart Pattern Recognition
- John Murphy's Market Message
- MurphyExplainsMarketAnalysis-Intermarket Analysis
- MurphyExplainsMarketAnalysis-Visual Analysis
- StockCharts.com
- Technical Analysis of the Financial Markets
- The Visual Investor
- VectorVest, Inc.
- Executive Premier Workshop
- One-Day Options Course
- OptionsPro
- Retirement Income Workshop
- Sure-Fire Trading Systems (VectorVest, Inc.)
- Trading as a Business Workshop
- VectorVest 7 EOD
- VectorVest 7 RealTime/IntraDay
- VectorVest AutoTester
- VectorVest Educational Services
- VectorVest OnLine
- VectorVest Options Analyzer
- VectorVest ProGraphics v6.0
- VectorVest ProTrader 7
- VectorVest RealTime Derby Tool
- VectorVest Simulator
- VectorVest Variator
- VectorVest Watchdog
