HOT TOPICS LIST
- MACD
- Fibonacci
- RSI
- Gann
- ADXR
- Stochastics
- Volume
- Triangles
- Futures
- Cycles
- Volatility
- ZIGZAG
- MESA
- Retracement
- Aroon
INDICATORS LIST
LIST OF TOPICS
PRINT THIS ARTICLE
by Donald W. Pendergast, Jr.
Stocks with high relative strength attract a lot of attention, helping drive prices even higher -- until the remaining buying power begins to diminish.
Position: N/A
Donald W. Pendergast, Jr.
Donald W. Pendergast is a financial markets consultant who offers specialized services to stock brokers and high net worth individuals who seek a better bottom line for their portfolios.
PRINT THIS ARTICLE
Is Harman International Ready For A Pause?
12/10/10 08:32:08 AMby Donald W. Pendergast, Jr.
Stocks with high relative strength attract a lot of attention, helping drive prices even higher -- until the remaining buying power begins to diminish.
Position: N/A
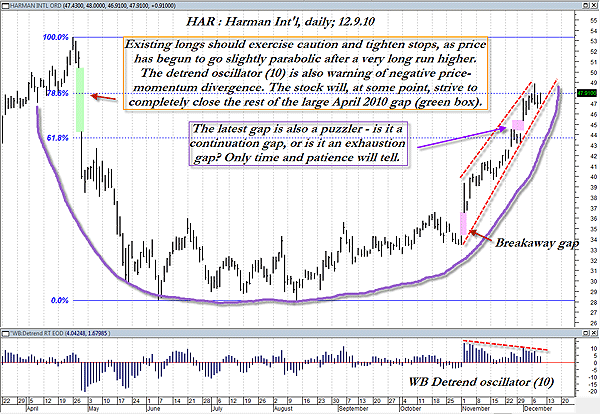
| Shares of Harman International (HAR), a Standard & Poor's 500 component stock, have done very nicely since ascending from a beautiful saucer pattern that formed in the wake of the April 2010 market smash. The stock ground away in a large sideways range for a few months before catching a bid in early to mid-August, just before it launched higher in a breakaway gap move in early November. The stock quickly ran up past the Fibonacci 62% retracement of the major April to June plunge and even managed to slightly exceed the next Fibonacci retracement, the 79% level, partially closing the large open gap caused by April's plunge. Obviously, this stock has had a major run higher, and there could very well be more gains to be seen through year-end, if not also in 2011. See Figure 1. |

|
| FIGURE 1: HAR, DAILY. This may not be a textbook-quality saucer pattern, but it still has good proportion. The big question now: Will the stock continue higher and soon close what's left of the huge April gap, or will it pull back and/or reverse before making such an attempt? |
| Graphic provided by: MetaStock. |
| Graphic provided by: WB Detrend RT EOD from ProfitTrader for MetaStock. |
| |
| Currently, the technical situation seems to imply this -- existing long holders should be ready to tighten stops on short notice and prospective acquirers of this stock should wait for a low-risk pullback to support before considering going long. The main reason for this revolves around the intertwined dynamics on the chart: 1. The stock has already had a major run and could said to be in parabolic mode now. 2. The recent gap higher may very well be an exhaustion gap (the type that warns of the impending end of a trend), seeing as how it has occurred in the midst of the parabolic surge higher, one that occurred even as the detrend oscillator (bottom of chart) is also giving plenty of warning of potential trend and/or price swing exhaustion. |
| If you're long and wish to protect substantial open profits, why not take a portion of your position off now (maybe half) and then use the red dashed trendline as a rough guide to alert you of a confirmed change in trend and a good reason to sell the rest of your shares? If the stock does sell off from here, it's possible that the recent open gap could also help provide some support, allowing nimble short-term traders a shot at timing a swing/bounce entry on the long side -- maybe on a 15- to 30-minute intraday chart. The possibilities for playing the markets are limited only by your level of experience, imagination, and account size. |
Donald W. Pendergast is a financial markets consultant who offers specialized services to stock brokers and high net worth individuals who seek a better bottom line for their portfolios.
| Title: | Writer, market consultant |
| Company: | Linear Trading Systems LLC |
| Jacksonville, FL 32217 | |
| Phone # for sales: | 904-239-9564 |
| E-mail address: | lineartradingsys@gmail.com |
Traders' Resource Links | |
| Linear Trading Systems LLC has not added any product or service information to TRADERS' RESOURCE. | |
Click here for more information about our publications!
PRINT THIS ARTICLE

Request Information From Our Sponsors
- StockCharts.com, Inc.
- Candle Patterns
- Candlestick Charting Explained
- Intermarket Technical Analysis
- John Murphy on Chart Analysis
- John Murphy's Chart Pattern Recognition
- John Murphy's Market Message
- MurphyExplainsMarketAnalysis-Intermarket Analysis
- MurphyExplainsMarketAnalysis-Visual Analysis
- StockCharts.com
- Technical Analysis of the Financial Markets
- The Visual Investor
- VectorVest, Inc.
- Executive Premier Workshop
- One-Day Options Course
- OptionsPro
- Retirement Income Workshop
- Sure-Fire Trading Systems (VectorVest, Inc.)
- Trading as a Business Workshop
- VectorVest 7 EOD
- VectorVest 7 RealTime/IntraDay
- VectorVest AutoTester
- VectorVest Educational Services
- VectorVest OnLine
- VectorVest Options Analyzer
- VectorVest ProGraphics v6.0
- VectorVest ProTrader 7
- VectorVest RealTime Derby Tool
- VectorVest Simulator
- VectorVest Variator
- VectorVest Watchdog
