

HOT TOPICS LIST
- MACD
- Fibonacci
- RSI
- Gann
- ADXR
- Stochastics
- Volume
- Triangles
- Futures
- Cycles
- Volatility
- ZIGZAG
- MESA
- Retracement
- Aroon
INDICATORS LIST
LIST OF TOPICS
PRINT THIS ARTICLE
by Billy Williams
Using simple indicators in combination, such as Bollinger bands and Keltner channels, can show you what's cooking in today's market.
Position: Hold
Billy Williams
Billy Williams has been trading the markets for 27 years, specializing in momentum trading with stocks and options.
PRINT THIS ARTICLE
BOLLINGER BANDS
What's Cooking In The Stock Market
12/09/10 01:34:56 PMby Billy Williams
Using simple indicators in combination, such as Bollinger bands and Keltner channels, can show you what's cooking in today's market.
Position: Hold
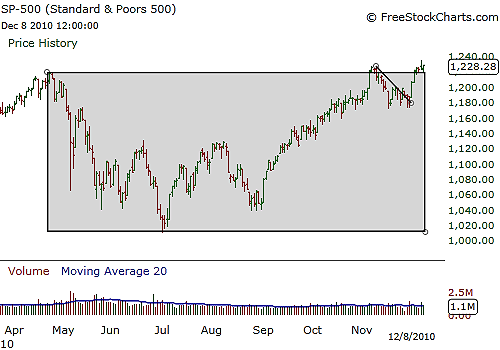
| Something smells good in the market these days, and with plenty of stocks starting to hit key price highs, there is plenty to pick from among the best and brightest stocks in today's current market. First, the stock market. Judging the stock market is a function of looking at the current price action of one or more of the major indexes. The big dog among the major indexes is the Standard & Poor's 500 (Figure 1), since it is made up of the 500 largest publicly traded companies in the US and is also made up of the largest sector of the US market, the financials. The S&P 500 can be likened to the Titanic in that it is a large ship that takes tremendous effort, energy, and force to turn in a given direction. Translated, it takes a lot of trading volume and market sentiment to get this index to move in a given direction or trend. The benefit of trading in the same direction as this index is that 70% to 80% of the market moves in the direction of the S&P. |
|
| FIGURE 1: S&P 500. The S&P 500 has been range-bound for most of 2010 but is now trading at the upper edge of resistance, indicating an upward move may be in order. |
| Graphic provided by: www.freestockcharts.com. |
| |
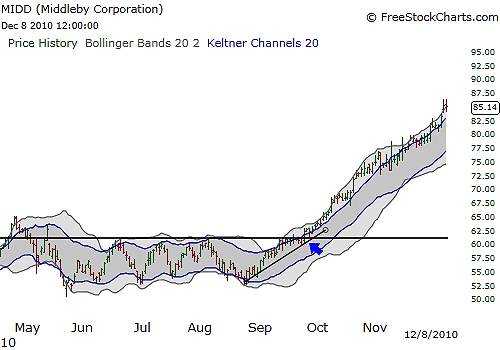
| So by having the momentum of the S&P on your side, you have a definable edge as you begin to search for stocks that are forming entry points in the same direction. The S&P has been range-bound since April 2010 until now while trading higher off a bottom in early July of 2010, challenging resistance at 1219. Price action has touched this level but backed off and is now trading at the upper end of that range, dancing along the resistance line, which indicates the possibility that price could explode upward from this point, provided that the right catalyst provides the impetus. This catalyst could be anything from higher trading volume, positive news affecting the market's outlook, surprised announcement on the peaceful reunification of Korea, and so forth. While the S&P is trading at annual highs, other segments of the market have formed up to extend their trends if the overall market trades higher. Middleby Corp. (Figure 2) is trading at all-time highs, approaching $87 a share after coming out of a contracted price range that lasted five months before breaking out and heading higher. Middleby designs and manufactures both custom and standard kitchen equipment, specifically commercial kitchen ovens. The world leader in kitchen ovens, Middleby has a presence both domestically as well as internationally, giving it footprints in Asia, the Middle East, and Europe. |
|
| FIGURE 2: MIDD. Middleby Corp. traded in a very tight range, revealed by Bollinger bands entering in and out of the Keltner channels, before pushing higher to all-time price highs. |
| Graphic provided by: www.freestockcharts.com. |
| |
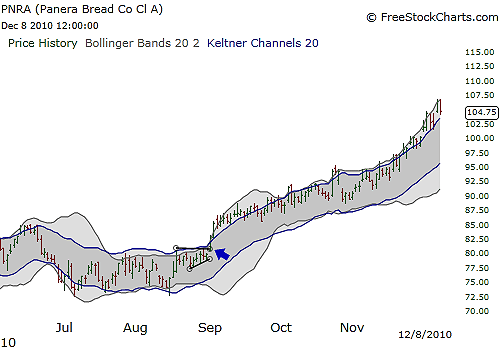
| Then there's Panera Inc., a franchise of bakeries/cafes trading at all-time price highs, nearing $107. Based out of St. Louis, MO, Panera (Figure 3) has just under 800 franchises throughout the country and is managed by an experienced team of leaders with an aggressive plan for expansion in a segment of the restaurant market in which they are a dominant force. Both of these stocks had compelling price action, particularly tight trading ranges that could be spotted either visually or with the aid of simple indicators like the Bollinger bands and Keltner channels. Bollinger bands are dynamic in that the upper, middle, and lower bands are generated by the amount of volatility expressed in the price action. As volatility expands, so do the bands, and vice versa. |
|
| FIGURE 3: PNRA. Panera met the conditions of contracted price action, tightening up in price before exploding upward to new highs. |
| Graphic provided by: www.freestockcharts.com. |
| |
| The Keltner channels are a function of the open and closing prices of the stock's daily price action, giving them a smoother visual average. When Bollinger bands contract within the Keltner channels, it shows price in a very tight trading range and provides you with a visual cue that price is likely to make a strong move in a given direction. |
Billy Williams has been trading the markets for 27 years, specializing in momentum trading with stocks and options.
| Company: | StockOptionSystem.com |
| E-mail address: | stockoptionsystem.com@gmail.com |
Traders' Resource Links | |
| StockOptionSystem.com has not added any product or service information to TRADERS' RESOURCE. | |
Click here for more information about our publications!
Comments
Date:�12/14/10Rank:�3Comment:�

Request Information From Our Sponsors
- VectorVest, Inc.
- Executive Premier Workshop
- One-Day Options Course
- OptionsPro
- Retirement Income Workshop
- Sure-Fire Trading Systems (VectorVest, Inc.)
- Trading as a Business Workshop
- VectorVest 7 EOD
- VectorVest 7 RealTime/IntraDay
- VectorVest AutoTester
- VectorVest Educational Services
- VectorVest OnLine
- VectorVest Options Analyzer
- VectorVest ProGraphics v6.0
- VectorVest ProTrader 7
- VectorVest RealTime Derby Tool
- VectorVest Simulator
- VectorVest Variator
- VectorVest Watchdog
- StockCharts.com, Inc.
- Candle Patterns
- Candlestick Charting Explained
- Intermarket Technical Analysis
- John Murphy on Chart Analysis
- John Murphy's Chart Pattern Recognition
- John Murphy's Market Message
- MurphyExplainsMarketAnalysis-Intermarket Analysis
- MurphyExplainsMarketAnalysis-Visual Analysis
- StockCharts.com
- Technical Analysis of the Financial Markets
- The Visual Investor