HOT TOPICS LIST
- MACD
- Fibonacci
- RSI
- Gann
- ADXR
- Stochastics
- Volume
- Triangles
- Futures
- Cycles
- Volatility
- ZIGZAG
- MESA
- Retracement
- Aroon
INDICATORS LIST
LIST OF TOPICS
PRINT THIS ARTICLE
by Chaitali Mohile
Is the steady and healthy bullish trend of Fossil, Inc., likely to be threatened?
Position: N/A
Chaitali Mohile
Active trader in the Indian stock markets since 2003 and a full-time writer. Trading is largely based upon technical analysis.
PRINT THIS ARTICLE
TECHNICAL INDICATORS
Fossil Entering Bearish Phase?
12/09/10 01:22:22 PMby Chaitali Mohile
Is the steady and healthy bullish trend of Fossil, Inc., likely to be threatened?
Position: N/A
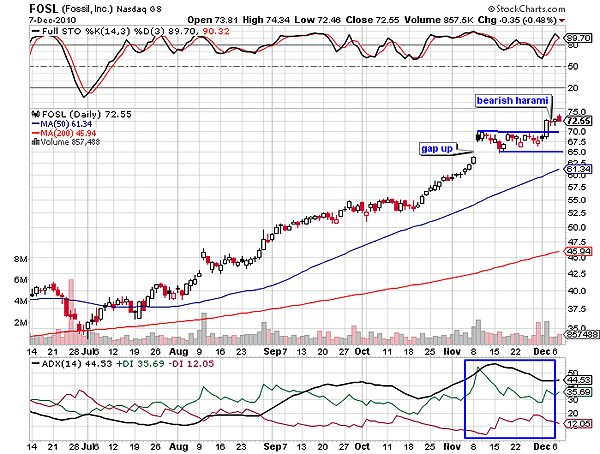
| The share value of Fossil, Inc. (FOSL), has appreciated nearly 50% in a time span of six months. An advance rally began in July with the robust support of the 200-day moving average (MA). The rally followed the direction of the 50-day and 200-day MA, gaining a profit of $35. The average directional index (ADX) (14) in Figure 1 gradually moved from the developing area (20 to 25) to the well-developed region (25 to 39). Throughout the rally, the full stochastic (14,3,3) moved in an overbought region, indicating a bullish momentum. Therefore, the stock rushed higher in these favorable conditions. Later, the gap-up opening in November dragged the uptrend to a highly overheated region, resulting in a sideways consolidation. |
| Due to consolidation, the ADX (14) descended from the 50 levels. The bullish consolidation in Figure 1 upheld the bullish sentiments as the buying pressure indicated by the positive directional index (+DI) was much stable. In addition, FOSL consolidated after an advance rally, forming a flag & pennant formation with a bullish breakout. Eventually, the pattern broke upward with moderate volume. But a bearish harami candlestick pattern in Figure 1 changed the picture for FOSL. The bearish harami candlestick is a group of two candles. The first white candle indicated bullishness and the existing uptrend of FOSL; the second small doji suggested bearish reversal conditions. The overheated uptrend confirmed the bearish reversal candlestick formation. |

|
| FIGURE 1: FOSL, DAILY. The overheated uptrend, the overbought stochastic, and the bearish harami candlestick formation are showing the trend reversal conditions for FOSL. |
| Graphic provided by: StockCharts.com. |
| |
| After the candlestick pattern appeared on the price chart, the stock formed the bearish candlestick (doji followed by the two red candles). The uptrend is still overheated and the stochastic oscillator is ready to dive from overbought area. Therefore, FOSL is likely to undergo an intermediate corrective rally that would temporarily reverse the existing bullish run. The stock has many strong supports, like the upper and lower range of the consolidation and the two MAs. Since the fresh bearish rally would be due to the extremely bullish indicators, FOSL is unlikely to lose many points from the current higher levels. |

|
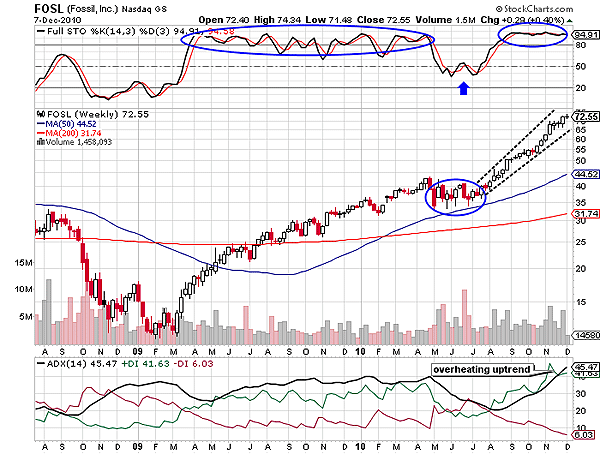
| FIGURE 2: FOSL, WEEKLY. The stock has moved steeply upward. |
| Graphic provided by: StockCharts.com. |
| |
| According to the weekly time frame in Figure 2, the stochastic sustained in the overbought region for a longer time. During the earlier rally, the oscillator was overbought for more than 10 months. Meanwhile, FOSL converted the MA resistance to support and reached the 44 levels. When the momentum oscillator dropped to 50 levels, price retraced to the 50-day MA support. We can see FOSL consolidating with the short-term MA support. The ADX (14) ranged between 30 and 40 levels, indicating the bullish hold on the trend. The bulls controlled the trend indicator by moving in an overheated region, highlighting the stability of the trend. While the price was consolidating in Figure 2, the ADX (14) plunged to 20 levels but the trend did not reverse. The bulls immediately grabbed the trend and resumed the journey. |
| A fresh rally that began with the 50-day MA support gradually surged to the new high at 72 levels. Both the indicators also moved higher and once again hit their extreme regions. The size of the candlesticks in the price rally is uneven and the stock has also steeply moved upward. The overbought stochastic oscillator and an overheated ADX (14) are not showing any alarming reversal possibilities in the near future. Currently, we can anticipate a slowdown in the price rally of FOSL. To conclude, the potential bearish rally would not seriously damage the bullishness of FOSL. The correction would be the cumulative result of the extremely bullish indicators and the current turbulence in the global market. |
Active trader in the Indian stock markets since 2003 and a full-time writer. Trading is largely based upon technical analysis.
| Company: | Independent |
| Address: | C1/3 Parth Indraprasth Towers. Vastrapur |
| Ahmedabad, Guj 380015 | |
| E-mail address: | chaitalimohile@yahoo.co.in |
Traders' Resource Links | |
| Independent has not added any product or service information to TRADERS' RESOURCE. | |
Click here for more information about our publications!
PRINT THIS ARTICLE

Request Information From Our Sponsors
- StockCharts.com, Inc.
- Candle Patterns
- Candlestick Charting Explained
- Intermarket Technical Analysis
- John Murphy on Chart Analysis
- John Murphy's Chart Pattern Recognition
- John Murphy's Market Message
- MurphyExplainsMarketAnalysis-Intermarket Analysis
- MurphyExplainsMarketAnalysis-Visual Analysis
- StockCharts.com
- Technical Analysis of the Financial Markets
- The Visual Investor
- VectorVest, Inc.
- Executive Premier Workshop
- One-Day Options Course
- OptionsPro
- Retirement Income Workshop
- Sure-Fire Trading Systems (VectorVest, Inc.)
- Trading as a Business Workshop
- VectorVest 7 EOD
- VectorVest 7 RealTime/IntraDay
- VectorVest AutoTester
- VectorVest Educational Services
- VectorVest OnLine
- VectorVest Options Analyzer
- VectorVest ProGraphics v6.0
- VectorVest ProTrader 7
- VectorVest RealTime Derby Tool
- VectorVest Simulator
- VectorVest Variator
- VectorVest Watchdog
