HOT TOPICS LIST
- MACD
- Fibonacci
- RSI
- Gann
- ADXR
- Stochastics
- Volume
- Triangles
- Futures
- Cycles
- Volatility
- ZIGZAG
- MESA
- Retracement
- Aroon
INDICATORS LIST
LIST OF TOPICS
PRINT THIS ARTICLE
by Chaitali Mohile
The potential bullish breakout of the Italy iShares could come to an end because of various resistance levels.
Position: N/A
Chaitali Mohile
Active trader in the Indian stock markets since 2003 and a full-time writer. Trading is largely based upon technical analysis.
PRINT THIS ARTICLE
SUPPORT & RESISTANCE
Italy iShares At Resistance
12/07/10 11:03:08 AMby Chaitali Mohile
The potential bullish breakout of the Italy iShares could come to an end because of various resistance levels.
Position: N/A
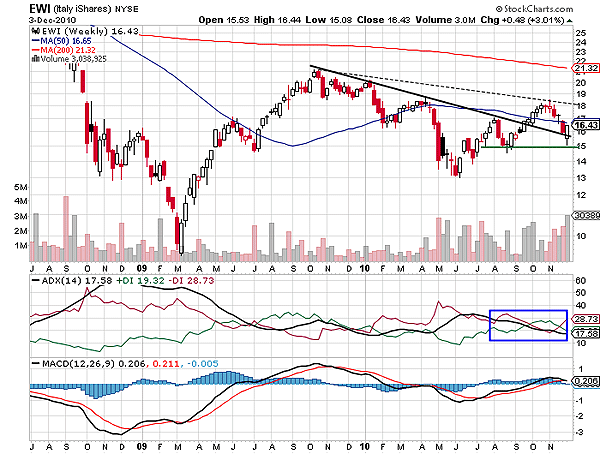
| The Italy iShares (EWI) has been showing weakness from October 2009. The index lacked strength to reach its previous high above 20 levels. EWI plunged below the 50-day moving average (MA) support, forming lower highs on the weekly time frame in Figure 1. The 200-day MA resistance was not even touched during the earlier pullback rally. The average directional index (ADX) did not indicate an uptrend. The trend turned weaker, but the bearish pressure gradually improved. However, EWI began to climb with the support of the 13 levels before a downtrend was developed. The rally faced first resistance by the descending trendline drawn in Figure 1. |

|
| FIGURE 1: EWI, WEEKLY |
| Graphic provided by: StockCharts.com. |
| |
| Along with the trendline, the 50-day MA resistance also restricted the intermediate pullback rally, and the index drifted a few points lowers. But the increasing volume protected the rally by retracing it towards the support at 13 levels. Eventually, the index breached the first trendline resistance in Figure 1 but paused near 18 levels. Here, we can see another trendline (dotted) drawn by joining the previous lower highs and the one formed in October 2010. The index plunged from the dotted trendline resistance and is likely to get trapped between the support/resistance of the trendlines and the 50-day MA resistance as well. |
| The ADX (14) continues to remain weak, but the volatile moving average convergence/divergence (MACD) (12,26,9) has moved into positive territory. Currently, the gap between the MACD line and the trigger line has dwindled, indicating a diminishing momentum in the rally. In such a scenario, the MACD would undergo a bearish crossover by moving below the trigger line. Therefore, the rally is likely to get crunched between the support and the various resistances on the weekly time frame. |

|
| FIGURE 2: EWI, DAILY |
| Graphic provided by: StockCharts.com. |
| |
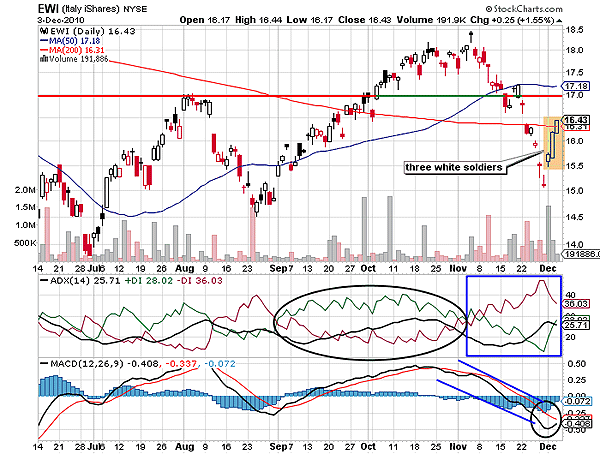
| After establishing support at 15 levels, EWI is trying to initiate a fresh bullish rally by breaching the robust 200-day MA resistance. During the process, EWI has formed a three white soldiers bullish reversal candlestick pattern in Figure 2. The candlestick pattern is a bullish formation that reverses the existing downtrend. As such, the downtrend for EWI was not well developed but the selling pressure was huge on the bearish rally from 18 to 15 levels. The third candle of the formation has closed above the 200-day MA resistance. However, we would need additional confirmation for the breakout of EWI. For the stable rally, the index has to open with the 200-day MA support on the following session (December 6). The fresh rally above the long-term MA has two resistance points on the bullish path. The support/resistance line in Figure 2 shows resistance at 17 levels, followed by the 50-day MA resistance. |
| Considering the huge selling pressure and the ADX line position, the downtrend is developing. In addition, the negative MACD (12,26,9) in Figure 2 is ready to turn positive after a bullish crossover in the next few sessions. Thus, the EWI breakout would fail under these various resistances on the daily as well as weekly time frame. |
Active trader in the Indian stock markets since 2003 and a full-time writer. Trading is largely based upon technical analysis.
| Company: | Independent |
| Address: | C1/3 Parth Indraprasth Towers. Vastrapur |
| Ahmedabad, Guj 380015 | |
| E-mail address: | chaitalimohile@yahoo.co.in |
Traders' Resource Links | |
| Independent has not added any product or service information to TRADERS' RESOURCE. | |
Click here for more information about our publications!
PRINT THIS ARTICLE

Request Information From Our Sponsors
- StockCharts.com, Inc.
- Candle Patterns
- Candlestick Charting Explained
- Intermarket Technical Analysis
- John Murphy on Chart Analysis
- John Murphy's Chart Pattern Recognition
- John Murphy's Market Message
- MurphyExplainsMarketAnalysis-Intermarket Analysis
- MurphyExplainsMarketAnalysis-Visual Analysis
- StockCharts.com
- Technical Analysis of the Financial Markets
- The Visual Investor
- VectorVest, Inc.
- Executive Premier Workshop
- One-Day Options Course
- OptionsPro
- Retirement Income Workshop
- Sure-Fire Trading Systems (VectorVest, Inc.)
- Trading as a Business Workshop
- VectorVest 7 EOD
- VectorVest 7 RealTime/IntraDay
- VectorVest AutoTester
- VectorVest Educational Services
- VectorVest OnLine
- VectorVest Options Analyzer
- VectorVest ProGraphics v6.0
- VectorVest ProTrader 7
- VectorVest RealTime Derby Tool
- VectorVest Simulator
- VectorVest Variator
- VectorVest Watchdog
