HOT TOPICS LIST
- MACD
- Fibonacci
- RSI
- Gann
- ADXR
- Stochastics
- Volume
- Triangles
- Futures
- Cycles
- Volatility
- ZIGZAG
- MESA
- Retracement
- Aroon
INDICATORS LIST
LIST OF TOPICS
PRINT THIS ARTICLE
by Alan R. Northam
In this analysis I use statistical analysis to determine the overall trend of NASDAQ 100.
Position: N/A
Alan R. Northam
Alan Northam lives in the Dallas, Texas area and as an electronic engineer gave him an analytical mind from which he has developed a thorough knowledge of stock market technical analysis. His abilities to analyze the future direction of the stock market has allowed him to successfully trade of his own portfolio over the last 30 years. Mr. Northam is now retired and trading the stock market full time. You can reach him at inquiry@tradersclassroom.com or by visiting his website at http://www.tradersclassroom.com. You can also follow him on Twitter @TradersClassrm.
PRINT THIS ARTICLE
A Statistical Analysis Of Qs
12/06/10 09:41:19 AMby Alan R. Northam
In this analysis I use statistical analysis to determine the overall trend of NASDAQ 100.
Position: N/A
| Statistical analysis of stock market trends is a pure mathematical approach to technical analysis, is objective, and avoids multicolinearity. Through the use of statistical mathematics it is possible to determine the direction of the trend, the momentum of the trend, the strength of the trend, and the volatility of the trend just as it is through the use of traditional technical analysis indicators. It is not widely used because it is not a well-understood discipline within the community of traders. In this analysis I look at the long-term, the intermediate, and short-term trend using statistical analysis to determine the overall technical condition of the Qs. |
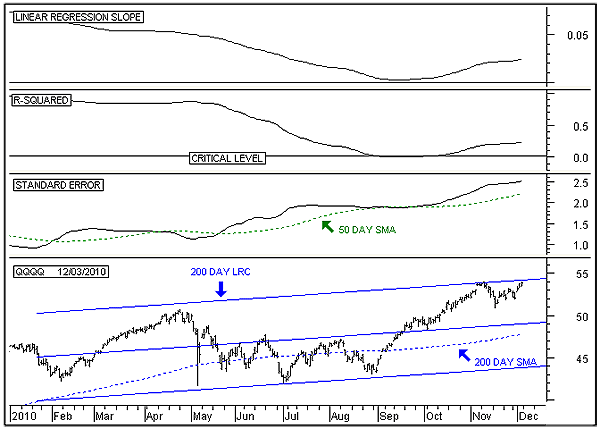
| Figure 1 shows the long-term trend of the Qs. The bottom panel shows the price action from the beginning of 2010. This panel shows the 200-day linear regression line (center upsloping blue line) and its upper and lower channel lines. This panel shows that the linear regression line is sloping in an upward direction, indicating that the long-term trend is in an upward direction. This panel also shows the 200-day simple moving average as confirmation. In the top panel I show the linear regression slope indicator. When this indicator is upsloping, it indicates price acceleration and when sloping down, it indicates price deceleration. Further, when this indicator is above its zero line, it indicates that the trend is upward and when below its zero line, indicates a downtrend. The second panel shows the R-squared indicator, which represents the strength of the trend. Note that this indicator is above its critical level and pointing upward. This indicates that the long-term trend has been strengthening since September, but it is not as strong as it was earlier in the year. The third panel is that of the standard error indicator, which is a measure of volatility. Volatility is a measure of the deviation of price from the linear regression line. In this panel, we see that this indicator continues to move upward and indicates a continuing increase in volatility. High levels of volatility normally indicate a change in trend ahead and this indicator is warning of such a change. This long-term statistical analysis indicates that the Qs remain in a strengthening uptrend but also shows that the current trend is not as strong as it was earlier in the year. This analysis also shows a continuing increase in volatility and warns of a major change in the direction of the trend ahead. Note that price is up against overhead resistance from the upper linear regression channel line, indicating that a reversal may not be too far ahead. |

|
| FIGURE 1: QQQQ, DAILY. This chart shows the 200-day linear regression channel on the price chart in the bottom panel, the linear regression slope indicator in the top panel, the R-squared indicator in the second panel, and the standard error indicator in the third. |
| Graphic provided by: MetaStock. |
| |
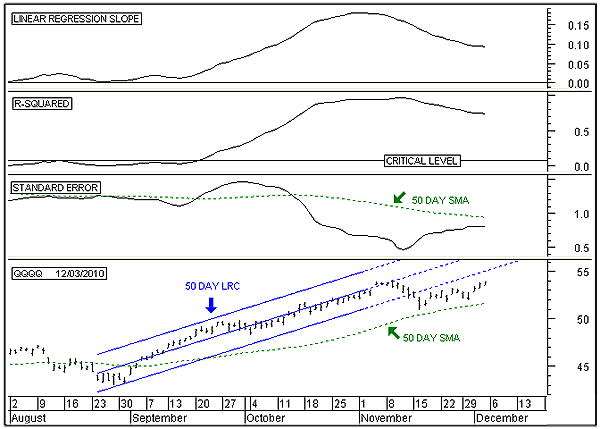
| Figure 2 shows the statistical analysis of the intermediate-term time frame of the Qs. The bottom panel of this chart shows the price action over the last several months. This panel shows the 50-day linear regression line along with its upper and lower channel lines. Note that from late August the linear regression line and its channel lines have been upsloping. The dotted blue lines indicate the extension lines of the 50-day linear regression line and its channel lines. This panel also shows that price has broken down below the extended linear regression channel, indicating the end of the intermediate-term trend that started in late August. Note, a change in trend does not necessarily indicate a new downwtrend is under way. A change of trend can indicate a horizontal trading range. The upper panel shows that price has been decelerating since late October. Price deceleration normally occurs just prior to a trend reversal. This analysis is consistent with the long-term volatility analysis warning of an upcoming change in the direction of the trend. The next lower panel (R-squared indicator) indicates a weakening of the intermediate-term upward trend. However, as long as this indicator remains above its critical level, there is a 95% probability that the intermediate-term upward trend will continue. The third panel down shows that the standard error indicator is below its moving average, indicating below-average volatility. Below-average volatility is an indication that the current trend will continues. However, not all is rosy, as this indicator is headed upward to test overhead resistance from its moving average. The analysis shows that the intermediate-term trend from late August has now ended. However, this analysis also shows that a new downtrend may continue to take its time in developing, as the R-squared indicator is still quite a ways from its critical level and the linear regression slope indicator is still quite a ways from its zero line. |

|
| FIGURE 2: QQQQ, DAILY.This chart shows the 50-day linear regression channel on the price chart in the bottom panel, the linear regression slope indicator in the top panel, the R-squared indicator in the second panel, and the standard error indicator in the third. |
| Graphic provided by: MetaStock. |
| |
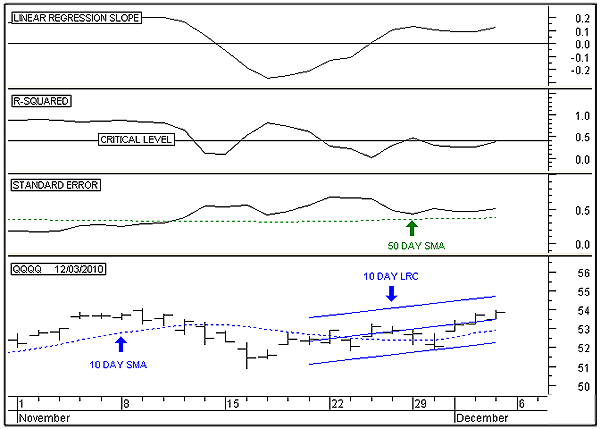
| Figure 3 is that of the short-term trend. This chart shows the 10-day linear regression line and its channel lines in the bottom panel. This panel shows that the linear regression line is upsloping, indicating that this short-term trend is heading upward. The linear regression slope indicator is pointing upward, indicating price acceleration over the short term. The R-squared indicator remains below its critical level, indicating a weak trend. The standard error indicator remains above its moving average, indicating increasing volatility. A weak uptrend and above-average volatility are signs that the short-term upward acceleration in price may not last. |

|
| FIGURE 3: QQQQ, DAILY.This chart shows the 10-day linear regression channel on the price chart in the bottom panel, the linear regression slope indicator in the top panel, the R-squared indicator in the second panel, and the standard error indicator in the third. |
| Graphic provided by: MetaStock. |
| |
| In conclusion, the Qs remain in a long-term uptrend. However, the rally from late August is now up against long-term overhead resistance and has broken down below its lower intermediate-term channel line. Over the short term, price may continue to press upward toward long-term overhead resistance. Since the intermediate-term trend has broken down below its lower channel line and since the short-term trend is weak with above-average volatility, expect price to bounce off the long-term overhead channel line and move back down to at least the long-term linear regression line. |
Alan Northam lives in the Dallas, Texas area and as an electronic engineer gave him an analytical mind from which he has developed a thorough knowledge of stock market technical analysis. His abilities to analyze the future direction of the stock market has allowed him to successfully trade of his own portfolio over the last 30 years. Mr. Northam is now retired and trading the stock market full time. You can reach him at inquiry@tradersclassroom.com or by visiting his website at http://www.tradersclassroom.com. You can also follow him on Twitter @TradersClassrm.
| Garland, Tx | |
| Website: | www.tradersclassroom.com |
| E-mail address: | inquiry@tradersclassroom.com |
Click here for more information about our publications!
PRINT THIS ARTICLE

|

Request Information From Our Sponsors
- StockCharts.com, Inc.
- Candle Patterns
- Candlestick Charting Explained
- Intermarket Technical Analysis
- John Murphy on Chart Analysis
- John Murphy's Chart Pattern Recognition
- John Murphy's Market Message
- MurphyExplainsMarketAnalysis-Intermarket Analysis
- MurphyExplainsMarketAnalysis-Visual Analysis
- StockCharts.com
- Technical Analysis of the Financial Markets
- The Visual Investor
- VectorVest, Inc.
- Executive Premier Workshop
- One-Day Options Course
- OptionsPro
- Retirement Income Workshop
- Sure-Fire Trading Systems (VectorVest, Inc.)
- Trading as a Business Workshop
- VectorVest 7 EOD
- VectorVest 7 RealTime/IntraDay
- VectorVest AutoTester
- VectorVest Educational Services
- VectorVest OnLine
- VectorVest Options Analyzer
- VectorVest ProGraphics v6.0
- VectorVest ProTrader 7
- VectorVest RealTime Derby Tool
- VectorVest Simulator
- VectorVest Variator
- VectorVest Watchdog
