HOT TOPICS LIST
- MACD
- Fibonacci
- RSI
- Gann
- ADXR
- Stochastics
- Volume
- Triangles
- Futures
- Cycles
- Volatility
- ZIGZAG
- MESA
- Retracement
- Aroon
INDICATORS LIST
LIST OF TOPICS
PRINT THIS ARTICLE
by Koos van der Merwe
... Not to Netflix. That is the question.
Position: Accumulate
Koos van der Merwe
Has been a technical analyst since 1969, and has worked as a futures and options trader with First Financial Futures in Johannesburg, South Africa.
PRINT THIS ARTICLE
ELLIOTT WAVE
To Netflix Or ...
12/06/10 09:03:58 AMby Koos van der Merwe
... Not to Netflix. That is the question.
Position: Accumulate
| On November 30, 2010, Netflix shares broke above the $200 level. At the same time, Morgan Stanley downgraded the share from a buy to a hold. On December 3, CNBC devoted 50% of its program time on discussions about whether investors should hold or sell the share. Jim Cramer of Mad Money, a man who has been pushing Netflix shares as a buy, announced that he had now moved from a buy to a hold. In the subsequent debate between CNBC's Hank Greenberg, Cramer, and an Oppenheimer analyst who is bullish on the stock while Greenberg is bearish, sparks flew, with Cramer swatting them aside in his boisterous way. So how do you feel about Netflix? I can only say that since its introduction into Canada, I have saved close to $60 per month, the amount of money my family spent on movies rented from Blockbuster, and the $7.99 paid to Netflix per month is well worth it. Multiply this by X number of viewers, and you have an idea of Netflix's income and potential income, especially if it hits the China market. |

|
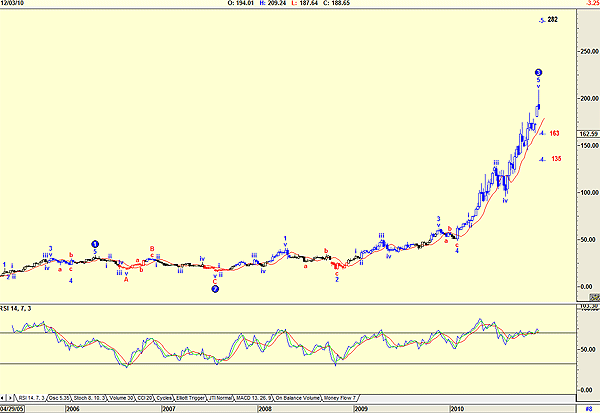
| FIGURE 1: NETFLIX, WEEKLY, WITH ELLIOTT WAVE COUNT |
| Graphic provided by: AdvancedGET. |
| |
| What do my charts say? My weekly chart, shown in Figure 1, has an Elliott wave count, suggesting that the share price is in a Wave 4 correction, to $163 or $135, but with a Wave 5 target of $282. The relative strength index (RSI) is suggesting a sell signal. |

|
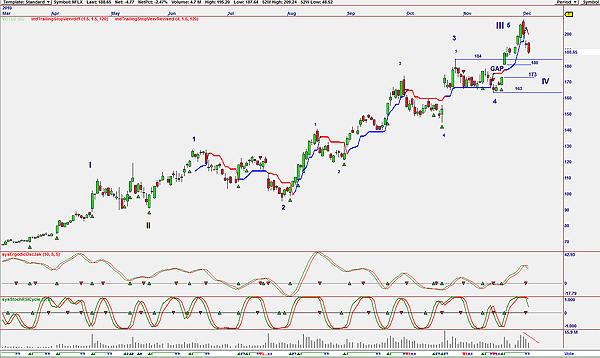
| FIGURE 2: NETFLIX. Here's the chart showing a new sell signal. |
| Graphic provided by: OmniTrader. |
| |
| Figure 2, a daily chart, shows the vote line giving a stop signal. The two indicators, the ergodic oscillator Jak variation and the stochastic RSI cycle, are both also showing sell signals, but do note how volume has fallen with a drop in the share price, suggesting strength. This drop in volume suggests that the fourth wave could turn closer to the $184 level of the fourth wave of lesser degree, probably testing the gap between $173 and $180. Charts show Netflix falling to somewhere between $173 and $180, but the charts also suggest that this could be a good buying opportunity, with prices rising strongly to the $282 level. Am I a Netflix fan? You bet I am. |
Has been a technical analyst since 1969, and has worked as a futures and options trader with First Financial Futures in Johannesburg, South Africa.
| Address: | 3256 West 24th Ave |
| Vancouver, BC | |
| Phone # for sales: | 6042634214 |
| E-mail address: | petroosp@gmail.com |
Click here for more information about our publications!
PRINT THIS ARTICLE

Request Information From Our Sponsors
- StockCharts.com, Inc.
- Candle Patterns
- Candlestick Charting Explained
- Intermarket Technical Analysis
- John Murphy on Chart Analysis
- John Murphy's Chart Pattern Recognition
- John Murphy's Market Message
- MurphyExplainsMarketAnalysis-Intermarket Analysis
- MurphyExplainsMarketAnalysis-Visual Analysis
- StockCharts.com
- Technical Analysis of the Financial Markets
- The Visual Investor
- VectorVest, Inc.
- Executive Premier Workshop
- One-Day Options Course
- OptionsPro
- Retirement Income Workshop
- Sure-Fire Trading Systems (VectorVest, Inc.)
- Trading as a Business Workshop
- VectorVest 7 EOD
- VectorVest 7 RealTime/IntraDay
- VectorVest AutoTester
- VectorVest Educational Services
- VectorVest OnLine
- VectorVest Options Analyzer
- VectorVest ProGraphics v6.0
- VectorVest ProTrader 7
- VectorVest RealTime Derby Tool
- VectorVest Simulator
- VectorVest Variator
- VectorVest Watchdog
