HOT TOPICS LIST
- MACD
- Fibonacci
- RSI
- Gann
- ADXR
- Stochastics
- Volume
- Triangles
- Futures
- Cycles
- Volatility
- ZIGZAG
- MESA
- Retracement
- Aroon
INDICATORS LIST
LIST OF TOPICS
PRINT THIS ARTICLE
by Donald W. Pendergast, Jr.
The year-end rally appears to be in high gear, with multisector breakouts occurring all over the place. Here's a look at a potentially low-risk long swing trade setup in a major financial industry issue.
Position: Buy
Donald W. Pendergast, Jr.
Donald W. Pendergast is a financial markets consultant who offers specialized services to stock brokers and high net worth individuals who seek a better bottom line for their portfolios.
PRINT THIS ARTICLE
MOMENTUM
CME Group Shares And Strong Momentum
12/03/10 09:18:32 AMby Donald W. Pendergast, Jr.
The year-end rally appears to be in high gear, with multisector breakouts occurring all over the place. Here's a look at a potentially low-risk long swing trade setup in a major financial industry issue.
Position: Buy
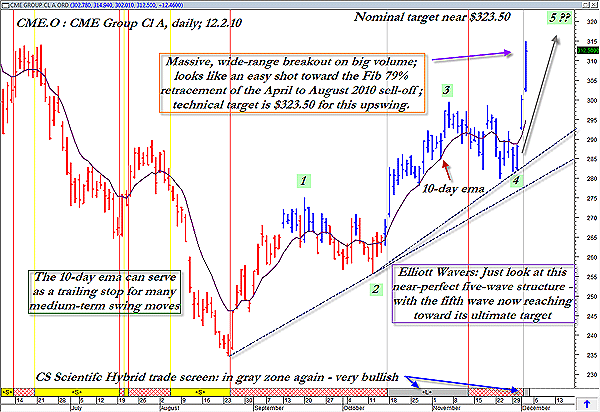
| CME Group (CME.O), the parent group of the Chicago Mercantile Exchange, has seen its shares do very well over the past three months or so, rising all the way from $234.50 on August 24 to $312.50 as of December 2. And the good news? This rally looks like it still has enough fuel to carry the stock even higher. Here's a closer look now (Figure 1): |

|
| FIGURE 1: CME.O, DAILY. With a very strong Elliott wave pattern seeking resolution in this high-flying stock, the probabilities appear to favor a run higher to at least the major 79% Fibonacci resistance level near $323.50. |
| Graphic provided by: MetaStock. |
| Graphic provided by: MetaStock v.11 CS Scientific expert advisor. |
| |
| I originally located this stock using the Robert Deel New Highs exploration in MetaStock v.11; this exploration screened my Standard & Poor's 500 component stocks for all issues making significant new highs. CME shares certainly qualify in this regard, but what really caught my attention on this daily chart is the near-perfect five-wave Elliott wave pattern that is in full bloom. It's all here -- the third wave is the longest wave (so far, unless the fifth wave decides to really take off), wave 4's low did not decline below the wave 1 high, and the fifth wave has now rocketed higher from a strong support area -- with a major rocketing move that appears to be right on target to hit the major Fibonacci resistance that resides at $323.50. The accelerating uptrend lines also provide some extra bullish confirmation, filling out this insanely bullish technical image. |
| As for playing this move in CME.O, why not wait for an intraday pullback on its 30-minute chart (using floor pivots, Fibonacci confluences, trendlines, and key moving averages such as the 21- and 50-period exponential moving averages) in the next session or two, looking to put on a low-risk swing play, one designed to capitalize not only on the stock's terrific momentum but also on the marketwide rally that is now beginning to gather steam. If you've been reading the articles here at Traders.com Advantage (TCA), then you probably already have a pretty good idea of how to position yourself to take advantage of any number of market setups that regularly make their appearance on the charts. |
| Spend some time scanning through your own stock database for your own list of high-flying momentum stocks. You may not only find stocks making new highs on big volume, but also those stocks that are in key Elliott wave or significant chart pattern configurations that can better help you determine how to more effectively trade the stocks you do locate. |
Donald W. Pendergast is a financial markets consultant who offers specialized services to stock brokers and high net worth individuals who seek a better bottom line for their portfolios.
| Title: | Writer, market consultant |
| Company: | Linear Trading Systems LLC |
| Jacksonville, FL 32217 | |
| Phone # for sales: | 904-239-9564 |
| E-mail address: | lineartradingsys@gmail.com |
Traders' Resource Links | |
| Linear Trading Systems LLC has not added any product or service information to TRADERS' RESOURCE. | |
Click here for more information about our publications!
Comments
Date: 12/07/10Rank: 5Comment:

Request Information From Our Sponsors
- StockCharts.com, Inc.
- Candle Patterns
- Candlestick Charting Explained
- Intermarket Technical Analysis
- John Murphy on Chart Analysis
- John Murphy's Chart Pattern Recognition
- John Murphy's Market Message
- MurphyExplainsMarketAnalysis-Intermarket Analysis
- MurphyExplainsMarketAnalysis-Visual Analysis
- StockCharts.com
- Technical Analysis of the Financial Markets
- The Visual Investor
- VectorVest, Inc.
- Executive Premier Workshop
- One-Day Options Course
- OptionsPro
- Retirement Income Workshop
- Sure-Fire Trading Systems (VectorVest, Inc.)
- Trading as a Business Workshop
- VectorVest 7 EOD
- VectorVest 7 RealTime/IntraDay
- VectorVest AutoTester
- VectorVest Educational Services
- VectorVest OnLine
- VectorVest Options Analyzer
- VectorVest ProGraphics v6.0
- VectorVest ProTrader 7
- VectorVest RealTime Derby Tool
- VectorVest Simulator
- VectorVest Variator
- VectorVest Watchdog
