HOT TOPICS LIST
- MACD
- Fibonacci
- RSI
- Gann
- ADXR
- Stochastics
- Volume
- Triangles
- Futures
- Cycles
- Volatility
- ZIGZAG
- MESA
- Retracement
- Aroon
INDICATORS LIST
LIST OF TOPICS
PRINT THIS ARTICLE
by Chaitali Mohile
Apple Inc. has recovered from its historical correction. The indicators and price charts show more appreciation in the share value.
Position: Hold
Chaitali Mohile
Active trader in the Indian stock markets since 2003 and a full-time writer. Trading is largely based upon technical analysis.
PRINT THIS ARTICLE
CONSOLID FORMATION
Apple Has A Long Way Ahead
12/03/10 12:53:10 PMby Chaitali Mohile
Apple Inc. has recovered from its historical correction. The indicators and price charts show more appreciation in the share value.
Position: Hold
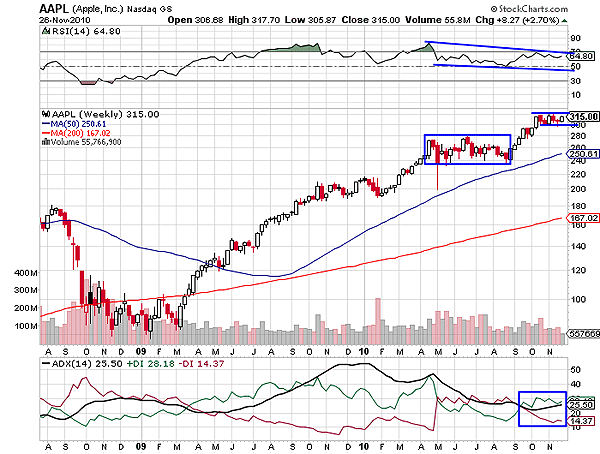
| Apple Inc. (AAPL) has been in a steady bullish trend since early 2009. All the previous losses that occurred due to the serious corrective phase in 2008 have been overcome. After violating the 200-day and 50-day moving average (MA) resistance, AAPL underwent the strong bullish run as seen in Figure 1. Minor consolidation during the rally gathered additional strength for the stock to rush higher. It was only then the two indicators in Figure 1 turned extremely bullish. AAPL then entered a short-term consolidation phase in April 2010 for four months. The average directional index (ADX) (14) and relative strength index (RSI) (14) were unable to sustain their levels in their highly overheated regions. The uptrend was overheated as the ADX (14) surged above 50 levels, indicating the possibility of a trend reversal. Thereafter, the trend indicator began descending. Though the price rally did not decline, it moved sideways. The RSI (14) formed a double top in an overbought region above 70 levels and plunged to 50 levels. The stock entered its bullish consolidation period. |

|
| FIGURE 1: AAPL, WEEKLY |
| Graphic provided by: StockCharts.com. |
| |
| Later, the sideways price action broke upward but could barely move. Due to the lessening uptrend, the selling pressure increased and captured the trend for a while. We can see the ADX (14) in Figure 1 has touched 20 levels and the negative directional index (-DI) has surged, indicating a developing downtrend. In addition, the RSI (14) showed a negative divergence toward the price rally. Therefore, the rally was terminated for a while and AAPL again consolidated in a very narrow range. However, the bullish momentum was much stronger than the incoming bearish force, so both indicators regained their bullish positions. Currently, the stock is consolidating in the range of 316 and 300 in Figure 1. This range is narrow for long-term traders but for the short term, it can be definitely considered for trading. |
| The consolidation has formed a short-term flag & pennant formation on the weekly time frame in Figure 1. The pattern is a bullish continuation pattern and breaks in an upward direction. Therefore, those holding long positions can add some more quantity to their portfolio and fresh buyers can enter at the breakout level as well. |

|
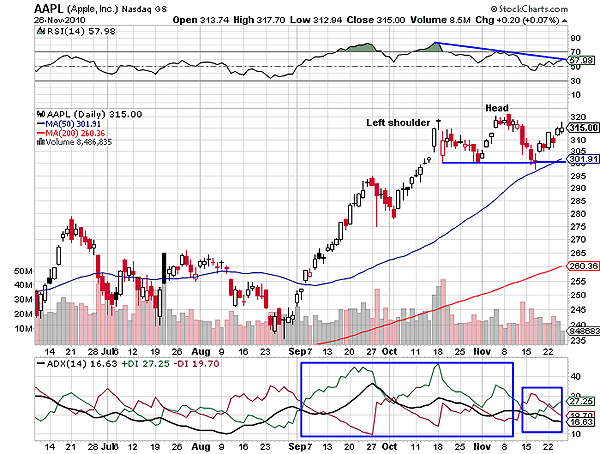
| FIGURE 2: AAPL, DAILY |
| Graphic provided by: StockCharts.com. |
| |
| The daily chart would give a better trading perspective. In Figure 2, we can see that a head & shoulder formed during the consolidation. The left shoulder and head is constructed, but the right shoulder is being formed. However, we cannot consider this formation as a trend reversal because the stock is consolidation. In addition, there are no topping situations indicated on the chart. AAPL is ready to plunge from 316 level to the lower support line at 300 levels. The negative divergence of the RSI (14) reconfirms the intermediate fall in the stock value. Short-term traders can enter short positions with the target of 302 (the 50-day MA support). The ADX (14) is highlighting weakness in the rally; therefore, no bullish rally can be anticipated in the next few sessions. But as the advance rally from 280 to 300 is followed by the consolidation, the stock is likely to break upward in the long term. Hence, traders can reverse their positions from 302 levels and hold if the stock breaks out. |
| The current volatility is a temporary phase for the stock. |
Active trader in the Indian stock markets since 2003 and a full-time writer. Trading is largely based upon technical analysis.
| Company: | Independent |
| Address: | C1/3 Parth Indraprasth Towers. Vastrapur |
| Ahmedabad, Guj 380015 | |
| E-mail address: | chaitalimohile@yahoo.co.in |
Traders' Resource Links | |
| Independent has not added any product or service information to TRADERS' RESOURCE. | |
Click here for more information about our publications!
Comments
Date: 12/07/10Rank: 4Comment:

Request Information From Our Sponsors
- VectorVest, Inc.
- Executive Premier Workshop
- One-Day Options Course
- OptionsPro
- Retirement Income Workshop
- Sure-Fire Trading Systems (VectorVest, Inc.)
- Trading as a Business Workshop
- VectorVest 7 EOD
- VectorVest 7 RealTime/IntraDay
- VectorVest AutoTester
- VectorVest Educational Services
- VectorVest OnLine
- VectorVest Options Analyzer
- VectorVest ProGraphics v6.0
- VectorVest ProTrader 7
- VectorVest RealTime Derby Tool
- VectorVest Simulator
- VectorVest Variator
- VectorVest Watchdog
- StockCharts.com, Inc.
- Candle Patterns
- Candlestick Charting Explained
- Intermarket Technical Analysis
- John Murphy on Chart Analysis
- John Murphy's Chart Pattern Recognition
- John Murphy's Market Message
- MurphyExplainsMarketAnalysis-Intermarket Analysis
- MurphyExplainsMarketAnalysis-Visual Analysis
- StockCharts.com
- Technical Analysis of the Financial Markets
- The Visual Investor
