

HOT TOPICS LIST
- MACD
- Fibonacci
- RSI
- Gann
- ADXR
- Stochastics
- Volume
- Triangles
- Futures
- Cycles
- Volatility
- ZIGZAG
- MESA
- Retracement
- Aroon
INDICATORS LIST
LIST OF TOPICS
PRINT THIS ARTICLE
by Mike Carr, CMT
Many news stories are saying that bonds are in a bubble, seemingly simply because many investors are buying them. Here's a subjective definition to answer the question.
Position: N/A
Mike Carr, CMT
Mike Carr, CMT, is a member of the Market Technicians Association, and editor of the MTA's newsletter, Technically Speaking. He is also the author of "Smarter Investing in Any Economy: The Definitive Guide to Relative Strength Investing," and "Conquering the Divide: How to Use Economic Indicators to Catch Stock Market Trends."
PRINT THIS ARTICLE
RATE OF CHANGE
Are Bonds A Bubble?
12/03/10 08:48:10 AMby Mike Carr, CMT
Many news stories are saying that bonds are in a bubble, seemingly simply because many investors are buying them. Here's a subjective definition to answer the question.
Position: N/A
| Calling a bubble has become sort of a national pastime among talking heads looking for publicity. Stocks were clearly in a bubble in 1999 and early 2000, and residential real estate was another bubble a few years later. Properly timing the end of a bubble can allow short sellers to profit, and just knowing a bubble is unfolding can help conservative investors avoid a disaster. |
| Bubbles are generally perceived as runaway price moves that are unsustainable in the short term. We can use some simple math to define that idea. Rapid price moves can be spotted with the rate of change (ROC) indicator; the higher the value of this indicator, the more likely a bubble is under way. Bollinger bands can help us objectively define when something is too high. The upper band is drawn two standard deviations above the average of the indicator -- mathematically, any value is expected to stay below this line 97.5% of the time. Therefore, we'll consider the possibility that a bubble is occurring when the ROC is above its upper Bollinger band. |
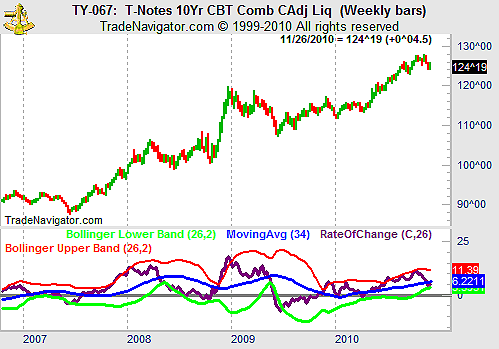
| For bonds, we'll look at the price of the 10-year US Treasury note futures contract. This is a key rate in the fixed-income market. Many consumer loans are pegged to this rate, and corporate bonds are often based on Treasury rates plus a risk premium. We'll use a 26-week ROC to capture recent price action. Figure 1 shows the current picture, and it appears to be far from bubble levels. |
|
| FIGURE 1: TY-067. A weekly chart of the 10-year Treasury contract shows that the rate of change in price doesn�t seem to be unusually high. |
| Graphic provided by: Trade Navigator. |
| |
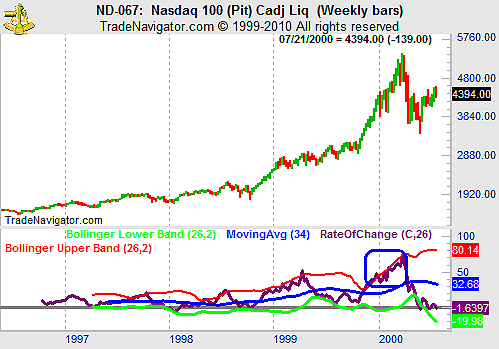
| For historical perspective, we can see if this indicator would have helped investors spot the NASDAQ bubble in the first months of 2000. That chart is Figure 2. |
|
| FIGURE 2: ND-067. The NASDAQ 100 index did reach what seems like bubble extremes in early 2000. |
| Graphic provided by: Trade Navigator. |
| |
| The ROC signaled that prices were rising rapidly and offered investors advance warning on the danger. While the ROC is not signaling a potential bond bubble, fundamental and economic data may point to declines. But for those depending on the media to help them spot bubbles, they might be better off looking at charts. |
Mike Carr, CMT, is a member of the Market Technicians Association, and editor of the MTA's newsletter, Technically Speaking. He is also the author of "Smarter Investing in Any Economy: The Definitive Guide to Relative Strength Investing," and "Conquering the Divide: How to Use Economic Indicators to Catch Stock Market Trends."
| Website: | www.moneynews.com/blogs/MichaelCarr/id-73 |
| E-mail address: | marketstrategist@gmail.com |
Click here for more information about our publications!
Comments
Date:�12/07/10Rank:�5Comment:�

Request Information From Our Sponsors
- StockCharts.com, Inc.
- Candle Patterns
- Candlestick Charting Explained
- Intermarket Technical Analysis
- John Murphy on Chart Analysis
- John Murphy's Chart Pattern Recognition
- John Murphy's Market Message
- MurphyExplainsMarketAnalysis-Intermarket Analysis
- MurphyExplainsMarketAnalysis-Visual Analysis
- StockCharts.com
- Technical Analysis of the Financial Markets
- The Visual Investor
- VectorVest, Inc.
- Executive Premier Workshop
- One-Day Options Course
- OptionsPro
- Retirement Income Workshop
- Sure-Fire Trading Systems (VectorVest, Inc.)
- Trading as a Business Workshop
- VectorVest 7 EOD
- VectorVest 7 RealTime/IntraDay
- VectorVest AutoTester
- VectorVest Educational Services
- VectorVest OnLine
- VectorVest Options Analyzer
- VectorVest ProGraphics v6.0
- VectorVest ProTrader 7
- VectorVest RealTime Derby Tool
- VectorVest Simulator
- VectorVest Variator
- VectorVest Watchdog