HOT TOPICS LIST
- MACD
- Fibonacci
- RSI
- Gann
- ADXR
- Stochastics
- Volume
- Triangles
- Futures
- Cycles
- Volatility
- ZIGZAG
- MESA
- Retracement
- Aroon
INDICATORS LIST
LIST OF TOPICS
PRINT THIS ARTICLE
by Billy Williams
Trader Richard Donchian had rules to tell him when the market is about to take off.
Position: Accumulate
Billy Williams
Billy Williams has been trading the markets for 27 years, specializing in momentum trading with stocks and options.
PRINT THIS ARTICLE
TECHNICAL ANALYSIS
Hugging Trendlines Before Market Surges
11/30/10 01:49:45 PMby Billy Williams
Trader Richard Donchian had rules to tell him when the market is about to take off.
Position: Accumulate
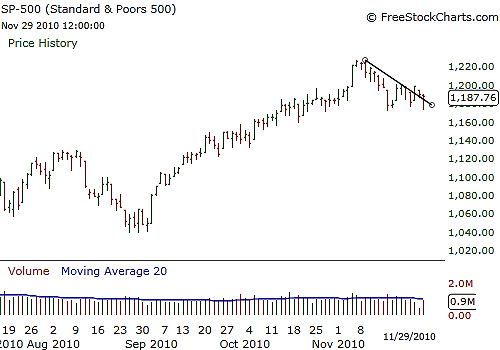
| The markets have retreated a bit off their previous annual price high of 1227, where resistance lies. This retreat is also common about this time of year as Wall Street stays home to eat turkey versus trading equities. Technically, the market remains up with distribution days few and far in between, which bodes well for a run into the end of year, which is also a seasonal pattern for the market. To pull that off, it will need an influx of volume, but that notwithstanding, the market is setting up on a technical level to make a run for it as well as a few key stocks. The Standard & Poor's 500 has drifted lower and has suffered three distribution days since its decline from November 5, 2010, but only one of them had any serious negative volume. The compelling thing about the index is that it is hugging the down trendline so closely. This enacts Richard Donchian's technical rule 4, which states that to "watch for 'crawling along' or repeated bumping of minor or major trendlines and prepare to see such trendlines broken." See Figure 1. |

|
| FIGURE 1: S&P 500. The S&P 500 is hugging a minor down trendline during a major uptrend. Any break could signal an entry, according to Richard Donchian. |
| Graphic provided by: www.freestockcharts.com. |
| |
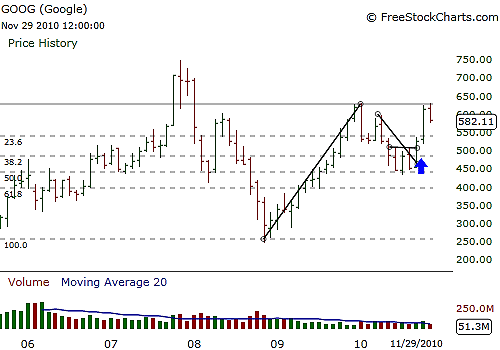
| Donchian believed that when price is hugging a minor trendline in the opposite direction of the major trend, a skilled trader should buy the move as it makes a strong move through this minor trendline, confirming it with volume. While you wait for the uptrend to resume in the larger market, Google (GOOG) is setting up in a cup & handle pattern on its five-year chart, presenting an opportunity for a long position, should it break above the upward pivot point (Figure 2). On the five-year chart, you can see where Google bottomed this time two years ago and then went on a strong bull run over the year before pulling back to its 0.50 Fibonacci retracement level. After that, the stock found support and began the slow crawl back to its annual price highs when it suddenly had a huge explosive gap upward. Now, price has traded downward, which is likely the cause of traders taking profits and consolidating their positions to adjust for the explosive move in price. |

|
| FIGURE 2: GOOG. Google's five-year chart shows a major cup & handle pattern forming. |
| Graphic provided by: www.freestockcharts.com. |
| |
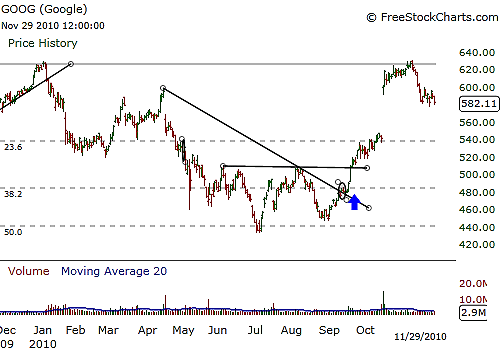
| The $627 level in the stock is acting as resistance, but if Google can firm up its price support without moving too far away from its highs, then once the S&P 500 resumes its upward move, Google may be a leadership stock to help take the market higher and punch through its resistance level (Figure 3). If it does, the $627 price level will become minor support instead of major resistance, adding another technical reason for this stock's price to trade up to its all-time high of $747. |

|
| FIGURE 3: GOOG. Google's price action shows resistance at the $627 level, but if the S&P resumes its uptrend, GOOG could break out above this price level. |
| Graphic provided by: www.freestockcharts.com. |
| |
| Look for Google to trade in a contracted range on light volume and wait for it to trade through the $627 level on breakaway volume or with a lap or gap price bar. Whichever day that price trades up through this level, watch for a gap or lap price bar and enter regardless of volume. If it's a wide-range bar, be sure it is two to three times the average daily trading range of the previous 20 days, while making sure its open is below the previous trading day's low before surging upward through resistance. Any of those three price patterns are actionable entries as outlined. |
Billy Williams has been trading the markets for 27 years, specializing in momentum trading with stocks and options.
| Company: | StockOptionSystem.com |
| E-mail address: | stockoptionsystem.com@gmail.com |
Traders' Resource Links | |
| StockOptionSystem.com has not added any product or service information to TRADERS' RESOURCE. | |
Click here for more information about our publications!
PRINT THIS ARTICLE

Request Information From Our Sponsors
- StockCharts.com, Inc.
- Candle Patterns
- Candlestick Charting Explained
- Intermarket Technical Analysis
- John Murphy on Chart Analysis
- John Murphy's Chart Pattern Recognition
- John Murphy's Market Message
- MurphyExplainsMarketAnalysis-Intermarket Analysis
- MurphyExplainsMarketAnalysis-Visual Analysis
- StockCharts.com
- Technical Analysis of the Financial Markets
- The Visual Investor
- VectorVest, Inc.
- Executive Premier Workshop
- One-Day Options Course
- OptionsPro
- Retirement Income Workshop
- Sure-Fire Trading Systems (VectorVest, Inc.)
- Trading as a Business Workshop
- VectorVest 7 EOD
- VectorVest 7 RealTime/IntraDay
- VectorVest AutoTester
- VectorVest Educational Services
- VectorVest OnLine
- VectorVest Options Analyzer
- VectorVest ProGraphics v6.0
- VectorVest ProTrader 7
- VectorVest RealTime Derby Tool
- VectorVest Simulator
- VectorVest Variator
- VectorVest Watchdog
