

HOT TOPICS LIST
- MACD
- Fibonacci
- RSI
- Gann
- ADXR
- Stochastics
- Volume
- Triangles
- Futures
- Cycles
- Volatility
- ZIGZAG
- MESA
- Retracement
- Aroon
INDICATORS LIST
LIST OF TOPICS
PRINT THIS ARTICLE
by Chaitali Mohile
The price rally of Steven Madden Ltd. is likely to slow down above an intermediate high resistance.
Position: N/A
Chaitali Mohile
Active trader in the Indian stock markets since 2003 and a full-time writer. Trading is largely based upon technical analysis.
PRINT THIS ARTICLE
TECHNICAL ANALYSIS
SHOO In Narrowing Range
11/30/10 12:22:39 PMby Chaitali Mohile
The price rally of Steven Madden Ltd. is likely to slow down above an intermediate high resistance.
Position: N/A
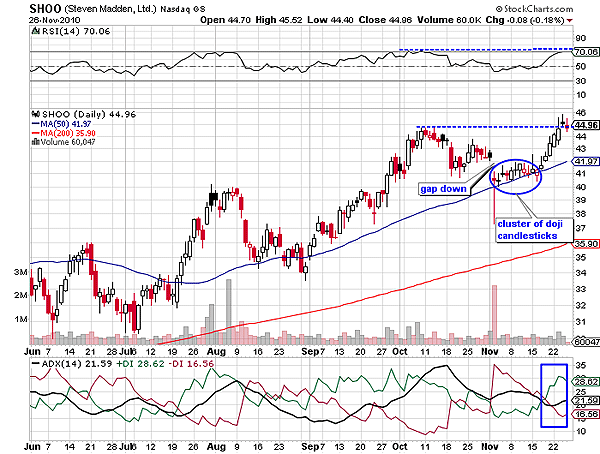
| After hitting a new intermediate high at $44, Steven Madden Ltd. (SHOO) plunged a few points. During the descent, SHOO witnessed a gap down near 41.97 and 41 levels. Due to the gap down, the stock could retrace toward the 50-day moving average (MA) support. We can see many small doji candlesticks with the support of the 50-day MA in Figure 1. The doji highlighted the volatility while establishing support. Gradually, the stock initiated a fresh pullback rally towards the previous high resistance near $44. The gap was filled by the price rally, creating another strong support for price action. A developed uptrend that was reversed due to the downside rally of SHOO once again popped up in Figure 1. The average directional index (ADX) (14) surged above 20 with buying pressure indicated by the positive directional index (+DI), reflecting the developing uptrend (see the blue rectangle). |
|
| FIGURE 1: SHOO, DAILY |
| Graphic provided by: StockCharts.com. |
| |
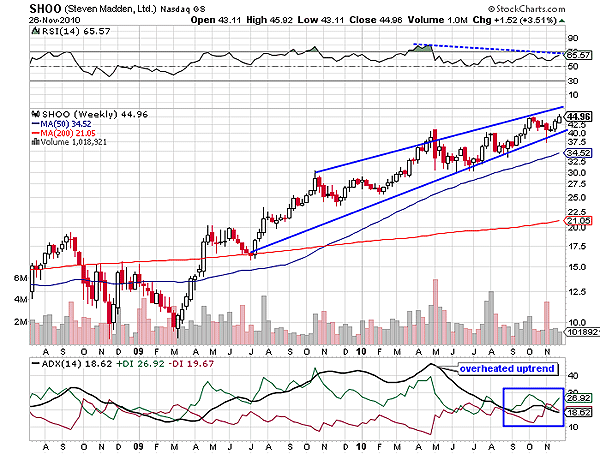
| Gradually, SHOO moved higher with marginal increase in bullish strength but the upper shadow of all the candlesticks showed reluctance for moving towards resistance. The strength was diminishing as the stock was nearing the previous high resistance. Price violated the resistance and made an intermediate new high. However, the relative strength index (RSI)(14) paused near the 70 level and is hesitant to breach the resistance level. This indicates a lack of confidence in the rally. The two doji candlesticks formed near $44 confirm the weakness in the rally. |
|
| FIGURE 2: SHOO, WEEKLY. The two converging trendlineS show the narrowing range of the stock. |
| Graphic provided by: StockCharts.com. |
| |
| A rising wedge -- a bearish reversal pattern -- is formed on the weekly time frame in Figure 2. Though SHOO steadily formed higher lows and higher highs, the narrowing range formed the rising pattern. The upper and the lower trendline are converging, indicating the possibility of a bearish breakout. It is likely that SHOO would continue to move in the narrow range till price actually breaks down. The negative divergence of the RSI (14) confirms the bearish breakout and volatility in the current scenario. An overheated uptrend has turned weaker in Figure 2. Therefore, the narrow trading range could turn volatile before breaking downward. |
| To conclude, the bullish rally of SHOO would slow down above the freshly formed support and could initiate a bearish rally in the future. |
Active trader in the Indian stock markets since 2003 and a full-time writer. Trading is largely based upon technical analysis.
| Company: | Independent |
| Address: | C1/3 Parth Indraprasth Towers. Vastrapur |
| Ahmedabad, Guj 380015 | |
| E-mail address: | chaitalimohile@yahoo.co.in |
Traders' Resource Links | |
| Independent has not added any product or service information to TRADERS' RESOURCE. | |
Click here for more information about our publications!
PRINT THIS ARTICLE

Request Information From Our Sponsors
- VectorVest, Inc.
- Executive Premier Workshop
- One-Day Options Course
- OptionsPro
- Retirement Income Workshop
- Sure-Fire Trading Systems (VectorVest, Inc.)
- Trading as a Business Workshop
- VectorVest 7 EOD
- VectorVest 7 RealTime/IntraDay
- VectorVest AutoTester
- VectorVest Educational Services
- VectorVest OnLine
- VectorVest Options Analyzer
- VectorVest ProGraphics v6.0
- VectorVest ProTrader 7
- VectorVest RealTime Derby Tool
- VectorVest Simulator
- VectorVest Variator
- VectorVest Watchdog
- StockCharts.com, Inc.
- Candle Patterns
- Candlestick Charting Explained
- Intermarket Technical Analysis
- John Murphy on Chart Analysis
- John Murphy's Chart Pattern Recognition
- John Murphy's Market Message
- MurphyExplainsMarketAnalysis-Intermarket Analysis
- MurphyExplainsMarketAnalysis-Visual Analysis
- StockCharts.com
- Technical Analysis of the Financial Markets
- The Visual Investor