HOT TOPICS LIST
- MACD
- Fibonacci
- RSI
- Gann
- ADXR
- Stochastics
- Volume
- Triangles
- Futures
- Cycles
- Volatility
- ZIGZAG
- MESA
- Retracement
- Aroon
INDICATORS LIST
LIST OF TOPICS
PRINT THIS ARTICLE
by Billy Williams
Pick the strongest stocks in the next runaway move by using the plurality of chart patterns concept.
Position: Hold
Billy Williams
Billy Williams has been trading the markets for 27 years, specializing in momentum trading with stocks and options.
PRINT THIS ARTICLE
CONSOLID FORMATION
Plurality Of Chart Patterns
11/29/10 10:20:29 AMby Billy Williams
Pick the strongest stocks in the next runaway move by using the plurality of chart patterns concept.
Position: Hold
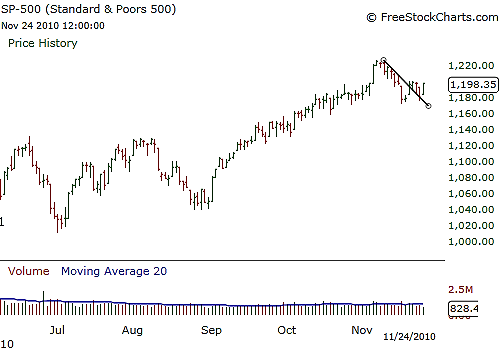
| When the general market is experiencing strong price action, it tends to influence the individual stocks in that its price action is mirrored. This is the result of a catch-22 where the strongest-performing stocks, also called the leaders, tend to lead the overall market either up or down while the rest of the market tends to follow the major indexes. As a result, chart patterns that form in the highest-performing corners of the market tend to also be reflected in the overall market. This is referred to as the plurality of chart patterns concept. See Figure 1. |

|
| FIGURE 1: S&P 500. After a big runup, the S&P 500 pulls back, forming a bullish flag pattern and setting the stage for leadership-level stocks to follow suit. |
| Graphic provided by: www.freestockcharts.com. |
| |
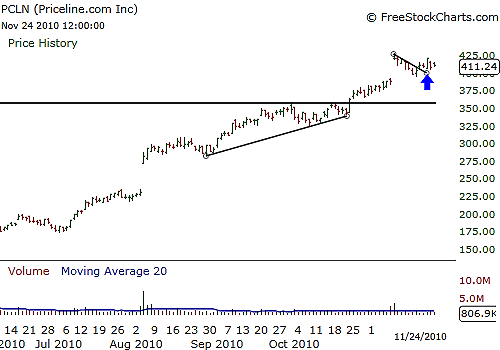
| Likewise, Priceline (Figure 2) gapped up higher in trading to just a little over $428 before pulling back slightly, probably the result of traders doing some profit taking on the upward surge in price but also forming a similar bullish flag pattern. Price has already started to trade upward after some very tight price action in a stock that has been a strong performer, leading the overall market higher. |

|
| FIGURE 2: PRICELINE.COM. PCLN is experiencing runaway bullish price action when it pulls back in price, forming a bullish flag pattern, mirroring the S&P. |
| Graphic provided by: www.freestockcharts.com. |
| |
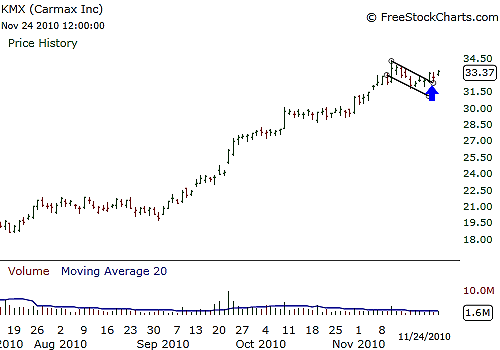
| Once again, KMX followed suit when, after experiencing a huge upward surge in price after breaking out on September 23, 2010, within the handle portion of weekly bullish cup & handle pattern, it reached a high of just over $34 before pulling back (Figure 3). Price continued to consolidate back and forth while slightly trending down. Eventually, the stock traded down for three straight days, which was obviously a sign of profit taking, then went on to trade in a very tight range and form a bullish flag pattern. On November 22, heading into Thanksgiving week, the stock traded higher on slightly higher than average volume, trading up through the upper trendline. When the market is healthy and marching strongly in a given direction, the plurality of chart patterns is important because while 70% or more of individual stocks tend to follow the overall market, the leaders in the stock market are responsible for most of the price action. As the term suggests, they will lead the market either up or down but their distinctive price action is reflected on both the larger scale and in their individual price. |

|
| FIGURE 3: CARMAX. KMX experienced a huge breakout, helping lead the upward charge in the S&P while forming a bullish flag pattern of its own. |
| Graphic provided by: www.freestockcharts.com. |
| |
| The strongest stocks will also tend to lead the market so by using the concept as a means to identify the stocks that are mirroring the larger market, you can gain an edge by taking your cues to enter and exit a position based on what these leaders do. The larger market will follow their lead and you will have the enviable position of catching the stock early on before other traders realize what you have already come to know: not only do the best stocks, the leaders, move in step with the larger market, but by using the plurality of chart patterns concept, you will be able to enter their run earlier before the market catches up. |
Billy Williams has been trading the markets for 27 years, specializing in momentum trading with stocks and options.
| Company: | StockOptionSystem.com |
| E-mail address: | stockoptionsystem.com@gmail.com |
Traders' Resource Links | |
| StockOptionSystem.com has not added any product or service information to TRADERS' RESOURCE. | |
Click here for more information about our publications!
Comments

Request Information From Our Sponsors
- StockCharts.com, Inc.
- Candle Patterns
- Candlestick Charting Explained
- Intermarket Technical Analysis
- John Murphy on Chart Analysis
- John Murphy's Chart Pattern Recognition
- John Murphy's Market Message
- MurphyExplainsMarketAnalysis-Intermarket Analysis
- MurphyExplainsMarketAnalysis-Visual Analysis
- StockCharts.com
- Technical Analysis of the Financial Markets
- The Visual Investor
- VectorVest, Inc.
- Executive Premier Workshop
- One-Day Options Course
- OptionsPro
- Retirement Income Workshop
- Sure-Fire Trading Systems (VectorVest, Inc.)
- Trading as a Business Workshop
- VectorVest 7 EOD
- VectorVest 7 RealTime/IntraDay
- VectorVest AutoTester
- VectorVest Educational Services
- VectorVest OnLine
- VectorVest Options Analyzer
- VectorVest ProGraphics v6.0
- VectorVest ProTrader 7
- VectorVest RealTime Derby Tool
- VectorVest Simulator
- VectorVest Variator
- VectorVest Watchdog
