HOT TOPICS LIST
- MACD
- Fibonacci
- RSI
- Gann
- ADXR
- Stochastics
- Volume
- Triangles
- Futures
- Cycles
- Volatility
- ZIGZAG
- MESA
- Retracement
- Aroon
INDICATORS LIST
LIST OF TOPICS
PRINT THIS ARTICLE
by Donald W. Pendergast, Jr.
Even the most hard-hit market sectors can recover given enough time. Here's a technical take on one of these "worst to first" market situations.
Position: N/A
Donald W. Pendergast, Jr.
Donald W. Pendergast is a financial markets consultant who offers specialized services to stock brokers and high net worth individuals who seek a better bottom line for their portfolios.
PRINT THIS ARTICLE
REL. STR COMPARATIVE
Fidelity Energy Services Top Fund Relative Strength
11/29/10 09:52:40 AMby Donald W. Pendergast, Jr.
Even the most hard-hit market sectors can recover given enough time. Here's a technical take on one of these "worst to first" market situations.
Position: N/A
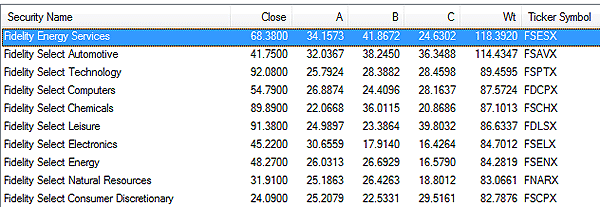
| The Fidelity Select Energy Services sector fund (FSESX) was one of the high-fliers during various parts of the 1990s and 2000s, at one point rising more than 2000% from the March 1992 low of $5.60 to the all-time high of $117.98 set in June 2008. Such gains handily outpaced those available from a 1% passbook savings account, even with the stomach-turning selloffs that occurred every few years in the fund during that amazing 16-year bull run. Then came the combined 1-2 whammy caused by the global financial crisis of 2007-09 and the ensuing commodities liquidation that started in July 2008, and the word "correction" couldn't even begin to describe the amount of damage that the stocks in the energy services group had inflicted upon themselves. In a five-month period, FSESX shed nearly 75% of its value, finally coming to rest in a crater at the $30.44 price area in November 2008. Over the past two years, however, the fund has managed to stage a slow but increasingly credible and technically significant recovery, one that we'll attempt to put in usable technical form for traders and investors now. See Figure 1. |

|
| FIGURE 1: FSESX. Energy-related sector funds are coming on strong lately. The energy services sector fund has top ranking of all 40 Select Sector funds on two of the three time frames used to make the calculation. |
| Graphic provided by: MetaStock. |
| Graphic provided by: MetaStock Explorer. |
| |
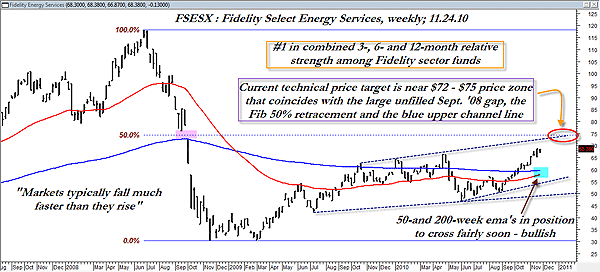
| Looking at Figure 2, everything just seemed to paint an unmistakable image, and that being FSESX would very likely remain strong until it had at least reached a very important resistance zone, the one circled in red. First, a little background: The Fidelity Select Energy Services sector fund (FSESX) ranks first in combined three-, six-, and 12-month relative strength rankings of all the Fidelity funds I track. When a fund is this strong, you simply must give the underlying trend every benefit of the doubt and resist the temptation to pick market tops. At the same time, however, if the technical evidence is strong enough, it can still be a wise move to locate areas of significant overhead resistance in such strongly trending markets, allowing for various what-if scenarios and ways to profit from various market outcomes. |

|
| FIGURE 2: FSESX, WEEKLY. When three dissimilar technical measures agree on a specific price or time target, astute traders will definitely want to make further inquiry. Here, the Fibonacci 50% retracement, the open September 2008 continuation gap (pink rectangle), and the ascending blue dashed channel line all agree that the area surrounding the $72 to $75 zone could be an important price target and/or resistance area for this fund. |
| Graphic provided by: MetaStock. |
| |
| On the weekly chart for FSESX, note how three dissimilar technical measures converge to suggest that the $72 to $75 zone is where FSESX is expected to hit a very meaningful resistance area, possibly even during the powerful up swing now in motion. Here are the three converging measures: 1. The Fibonacci 50% retracement of the massive 2008 crash is at $74.60. 2. The large unfilled continuation gap of late September-early October 2008 spans the price range from $75.97 to $72.83. 3. The upper channel line (blue dashed line on chart), when extended, dovetails nicely with the previously mentioned Fibonacci 50% retracement, giving a possible target date in the first month or two of 2011. Taken individually, these measures aren't too special, but when combined to produce remarkably similar price targets, they take on greatly increased importance -- particularly in this instance where we're analyzing a sector fund with massively strong relative strength versus its market peers. So the odds are pretty good that FSESX will at least give the $72 to $75 zone a good run for the money, probably within the next couple of months. Interestingly, with natural gas becoming more visible on trader's radar screens of late (and with some fundamental analysts expecting natural gas to quickly double or even triple in the next few years), the energy services sector stocks may have some added price support and/or appreciation advantages going for them if the natural gas market suddenly becomes the next really hot commodities play. |
| So what about some ways to play this incredible (and projected) strength in the energy services sector? Well, how about running your own relative strength scan on the key component stocks in the energy services sector -- names like Halliburton (HAL), Schlumberger (SLB), Diamond Offshore Drilling (DO), and Rowan Cos. (ROW) -- and then doing some more scanning to locate the most attractive covered call candidates among these energy services giants? This makes a lot of sense, given the strength of this sector and the likelihood that FSESX will at least make a strong attempt to be reconciled to the heavy resistance coming in near $72 to $75. Do some research in your Tthinkorswim, TradeStation, E-Trade, or Interactive Brokers option scanning platforms and see what kind of covered call deals are hot right now in these stocks. For starters, look for at-the-money (ATM) calls (these have the most amount of time premium) expiring in December and January in order to make the most of FSESX's current strength, but without overstaying the party. The bid-ask spread on ATM calls in each of these stocks is above average, so just try to work the best deal you can, perhaps using intraday timing to get the most amount of premium you can from the sold calls. Remember that you need to own 100 shares of stock for each call sold (or multiples thereof), so make sure you have enough cash in your margin account to properly get positioned for each position you wish to acquire. Once you've settled on the best energy services-related covered call plays for your situation, why not just use weekly charts, key moving averages (the 20- and 50-week may be wise), and simple trendlines to manage your open positions until option expiration, allowing the positions sufficient room to breathe between now and options expiration in December and/or January. And as long as FSESX remains strong in relative strength rank, these could be some of the lowest-risk covered call plays you're going to encounter over the next few months. Make the most of the opportunity if you can. |
Donald W. Pendergast is a financial markets consultant who offers specialized services to stock brokers and high net worth individuals who seek a better bottom line for their portfolios.
| Title: | Writer, market consultant |
| Company: | Linear Trading Systems LLC |
| Jacksonville, FL 32217 | |
| Phone # for sales: | 904-239-9564 |
| E-mail address: | lineartradingsys@gmail.com |
Traders' Resource Links | |
| Linear Trading Systems LLC has not added any product or service information to TRADERS' RESOURCE. | |
Click here for more information about our publications!
PRINT THIS ARTICLE

Request Information From Our Sponsors
- StockCharts.com, Inc.
- Candle Patterns
- Candlestick Charting Explained
- Intermarket Technical Analysis
- John Murphy on Chart Analysis
- John Murphy's Chart Pattern Recognition
- John Murphy's Market Message
- MurphyExplainsMarketAnalysis-Intermarket Analysis
- MurphyExplainsMarketAnalysis-Visual Analysis
- StockCharts.com
- Technical Analysis of the Financial Markets
- The Visual Investor
- VectorVest, Inc.
- Executive Premier Workshop
- One-Day Options Course
- OptionsPro
- Retirement Income Workshop
- Sure-Fire Trading Systems (VectorVest, Inc.)
- Trading as a Business Workshop
- VectorVest 7 EOD
- VectorVest 7 RealTime/IntraDay
- VectorVest AutoTester
- VectorVest Educational Services
- VectorVest OnLine
- VectorVest Options Analyzer
- VectorVest ProGraphics v6.0
- VectorVest ProTrader 7
- VectorVest RealTime Derby Tool
- VectorVest Simulator
- VectorVest Variator
- VectorVest Watchdog
