

HOT TOPICS LIST
- MACD
- Fibonacci
- RSI
- Gann
- ADXR
- Stochastics
- Volume
- Triangles
- Futures
- Cycles
- Volatility
- ZIGZAG
- MESA
- Retracement
- Aroon
INDICATORS LIST
LIST OF TOPICS
PRINT THIS ARTICLE
by Chaitali Mohile
Russell 2000 Small Cap Index is undergoing a relief rally. Will this rally sustain its momentum?
Position: N/A
Chaitali Mohile
Active trader in the Indian stock markets since 2003 and a full-time writer. Trading is largely based upon technical analysis.
PRINT THIS ARTICLE
SUPPORT & RESISTANCE
Russell 2000 Retesting Support
11/24/10 01:47:14 PMby Chaitali Mohile
Russell 2000 Small Cap Index is undergoing a relief rally. Will this rally sustain its momentum?
Position: N/A
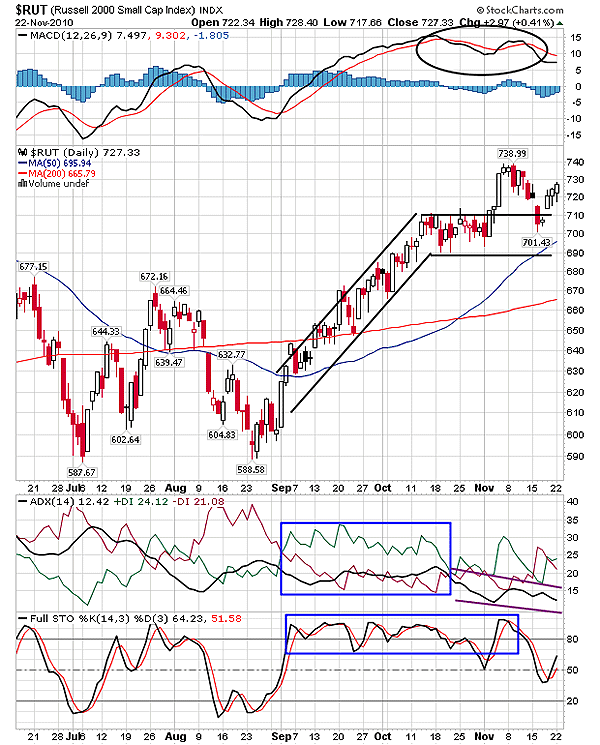
| A sharp rally of the Russell 2000 Small Cap Index ($RUT) consolidated at 710 levels with lower support near 690. The advance rally formed a short-term bullish flag & pennant formation in Figure 1. The consolidation period of $RUT was very short, which later breached upward, resuming the previous upward move. However, the weak uptrend indicated by the average directional index (ADX) (14) terminated the fresh breakout rally. The index hardly surged to 738 levels and began drifting down. The moving average convergence/divergence (MACD) (12,26,9) formed a lower high as price hit a new peak at 738 levels. Therefore, the combnation of a negative divergence in the MACD (12,26,9), the shaky full stochastic (14,3,3) and the weakening uptrend confirmed the failure of the bullish breakout move. |
|
| FIGURE 1: $RUT,DAILY |
| Graphic provided by: StockCharts.com. |
| |
| Since the bullish flag & pennant formation was very short term, the breakout failure cannot be considered to be a major trend reversal but would definitely lead to a weakness in the rally. The index retraced below the initial support of the upper consolidation and rested with the next support at 700 levels. Apart from the weak trend, the other two oscillators were holding their bullishness, which validates the pullback from 700 levels. The upper range resistance has converted to support. In such a scenario, the index is likely to reach the previous high resistance of 738 levels. |
|
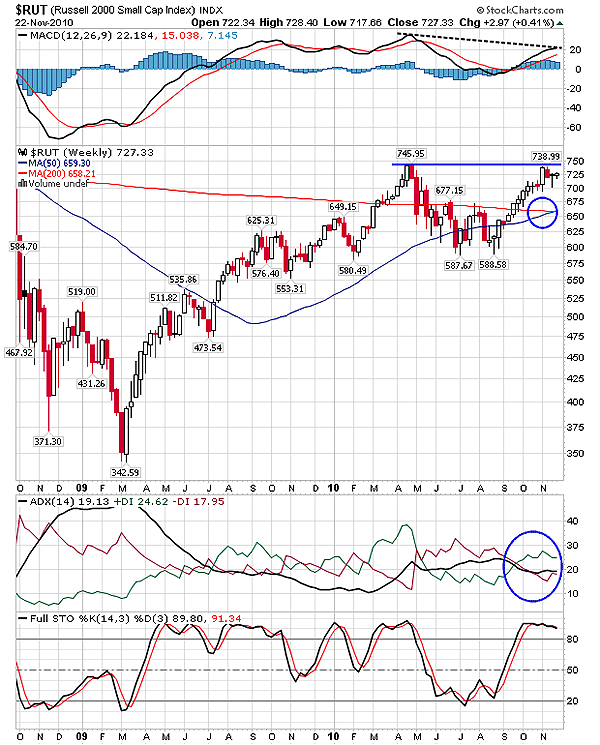
| FIGURE 2: $RUT, WEEKLY |
| Graphic provided by: StockCharts.com. |
| |
| If you look at the weekly time frame in Figure 2, you will see that $RUT had formed a new high at 745 levels in April 2010. Later, the index lost about 150 points, plunging below the 200-day and 50-day moving average (MA) support levels. The relief rally from 588 levels marked a marginally lower high at 739 levels. The difference between the earlier and current high is hardly five points; therefore, we can consider it as a double-top formation. The double top is a bearish reversal formation that begins a fresh bearish rally, reversing the existing uptrend. After hitting another high at 739 levels, $RUT has retraced marginally. The double-top formation would add bearish force to the index. The lower high of the MACD (12,26,9) shows weakness in the existing pullback rally. The stochastic oscillator is highly overbought in Figure 2 and the ADX (14) is showing a weak uptrend; hence, it is likely that $RUT would be reluctant to breach the previous high resistance of 739 levels. The two MAs have converged, developing robust bullish support at 650 levels. |
| Thus, $RUT would face strong resistance above 739 levels and witness high volatility in the higher areas. |
Active trader in the Indian stock markets since 2003 and a full-time writer. Trading is largely based upon technical analysis.
| Company: | Independent |
| Address: | C1/3 Parth Indraprasth Towers. Vastrapur |
| Ahmedabad, Guj 380015 | |
| E-mail address: | chaitalimohile@yahoo.co.in |
Traders' Resource Links | |
| Independent has not added any product or service information to TRADERS' RESOURCE. | |
Click here for more information about our publications!
PRINT THIS ARTICLE

Request Information From Our Sponsors
- StockCharts.com, Inc.
- Candle Patterns
- Candlestick Charting Explained
- Intermarket Technical Analysis
- John Murphy on Chart Analysis
- John Murphy's Chart Pattern Recognition
- John Murphy's Market Message
- MurphyExplainsMarketAnalysis-Intermarket Analysis
- MurphyExplainsMarketAnalysis-Visual Analysis
- StockCharts.com
- Technical Analysis of the Financial Markets
- The Visual Investor
- VectorVest, Inc.
- Executive Premier Workshop
- One-Day Options Course
- OptionsPro
- Retirement Income Workshop
- Sure-Fire Trading Systems (VectorVest, Inc.)
- Trading as a Business Workshop
- VectorVest 7 EOD
- VectorVest 7 RealTime/IntraDay
- VectorVest AutoTester
- VectorVest Educational Services
- VectorVest OnLine
- VectorVest Options Analyzer
- VectorVest ProGraphics v6.0
- VectorVest ProTrader 7
- VectorVest RealTime Derby Tool
- VectorVest Simulator
- VectorVest Variator
- VectorVest Watchdog