HOT TOPICS LIST
- MACD
- Fibonacci
- RSI
- Gann
- ADXR
- Stochastics
- Volume
- Triangles
- Futures
- Cycles
- Volatility
- ZIGZAG
- MESA
- Retracement
- Aroon
INDICATORS LIST
LIST OF TOPICS
PRINT THIS ARTICLE
by Mike Carr, CMT
Relative strength warned investors that the outlook for Cisco might not have been as rosy as investors hoped.
Position: N/A
Mike Carr, CMT
Mike Carr, CMT, is a member of the Market Technicians Association, and editor of the MTA's newsletter, Technically Speaking. He is also the author of "Smarter Investing in Any Economy: The Definitive Guide to Relative Strength Investing," and "Conquering the Divide: How to Use Economic Indicators to Catch Stock Market Trends."
PRINT THIS ARTICLE
RATE CHANGE - PRICE
Technicals Can Lead The News
11/23/10 02:40:41 PMby Mike Carr, CMT
Relative strength warned investors that the outlook for Cisco might not have been as rosy as investors hoped.
Position: N/A
| Cisco (CSCO) stock fell on November 11 after the company announced that it would see slower revenue and earnings growth. The CEO warned that lower government spending would mean decreased sales for the computer network equipment maker. Investors were surprised to learn that revenue would probably rise by less than half of what analysts had predicted for its November-through-January quarter. |
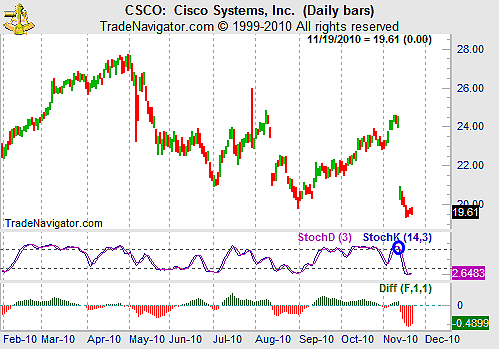
| After the news came out, the price of CSCO fell by more than 16% (Figure 1). Standard technical indicators gave no warning of the impending decline. |

|
| FIGURE 1: CSCO, DAILY. The technical picture for CSCO had fully recovered from the August drop and was bullish before the big drop in November. |
| Graphic provided by: Trade Navigator. |
| |
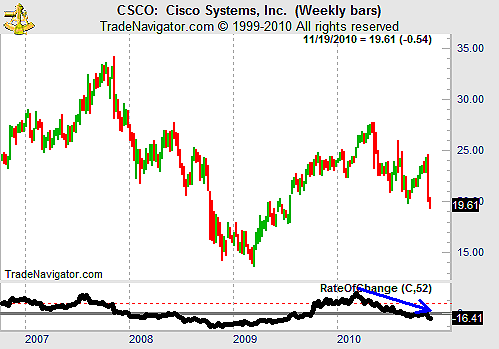
| Longer-term charts showed a different picture. Relative strength had been falling all year, offering traders a warning that the stock was not likely to see further gains (Figure 2). In this chart, the 52-week rate of change is shown as a measure of relative strength. |

|
| FIGURE 2: CSCO, WEEKLY. The rate of change of price was bearish, before the price declined. |
| Graphic provided by: Trade Navigator. |
| |
| There are two lesson traders can take from this example. First, looking at multiple time frames can help traders spot potential problems. In this case, the weekly chart showed weakness before the daily chart did. Second is that trends in relative strength can be used to confirm the direction of the price trend, and divergences offer a sign that the stock could be ready to reverse. |
Mike Carr, CMT, is a member of the Market Technicians Association, and editor of the MTA's newsletter, Technically Speaking. He is also the author of "Smarter Investing in Any Economy: The Definitive Guide to Relative Strength Investing," and "Conquering the Divide: How to Use Economic Indicators to Catch Stock Market Trends."
| Website: | www.moneynews.com/blogs/MichaelCarr/id-73 |
| E-mail address: | marketstrategist@gmail.com |
Click here for more information about our publications!
Comments
Date: 11/30/10Rank: 3Comment:

Request Information From Our Sponsors
- StockCharts.com, Inc.
- Candle Patterns
- Candlestick Charting Explained
- Intermarket Technical Analysis
- John Murphy on Chart Analysis
- John Murphy's Chart Pattern Recognition
- John Murphy's Market Message
- MurphyExplainsMarketAnalysis-Intermarket Analysis
- MurphyExplainsMarketAnalysis-Visual Analysis
- StockCharts.com
- Technical Analysis of the Financial Markets
- The Visual Investor
- VectorVest, Inc.
- Executive Premier Workshop
- One-Day Options Course
- OptionsPro
- Retirement Income Workshop
- Sure-Fire Trading Systems (VectorVest, Inc.)
- Trading as a Business Workshop
- VectorVest 7 EOD
- VectorVest 7 RealTime/IntraDay
- VectorVest AutoTester
- VectorVest Educational Services
- VectorVest OnLine
- VectorVest Options Analyzer
- VectorVest ProGraphics v6.0
- VectorVest ProTrader 7
- VectorVest RealTime Derby Tool
- VectorVest Simulator
- VectorVest Variator
- VectorVest Watchdog
