HOT TOPICS LIST
- MACD
- Fibonacci
- RSI
- Gann
- ADXR
- Stochastics
- Volume
- Triangles
- Futures
- Cycles
- Volatility
- ZIGZAG
- MESA
- Retracement
- Aroon
INDICATORS LIST
LIST OF TOPICS
PRINT THIS ARTICLE
by Billy Williams
When the unexpected happens, you need a backup plan so you don't miss a runaway move.
Position: Hold
Billy Williams
Billy Williams has been trading the markets for 27 years, specializing in momentum trading with stocks and options.
PRINT THIS ARTICLE
BREAKAWAY GAP
How To Enter Trades With Gaps And Laps
11/24/10 01:11:04 PMby Billy Williams
When the unexpected happens, you need a backup plan so you don't miss a runaway move.
Position: Hold
| For momentum traders, one of the problems when trading explosive price action is timing entries into a runaway move. For momentum traders, entries are trickier than other styles of trading, because while that fast-paced price action is what attracts you to a particular stock to begin with, that is the very thing that make entries into that price action a real challenge. At times, the point at which the stock is consolidating right before a potential breakout can be a source of both excitement and anxiety -- excitement because of the positive anticipation of latching onto a move that can make a lot of money in a short period of time, and anxiety because of the unknown, the uncertainty of what is going to happen, combined with the negative anticipation that you may not be prepared or make a mistake. This is normal and having a few key statistics on your side can be a huge help in dealing with these normal emotional states that are symptomatic of trading runaway moves. |
| First, consider the traditional method that is taught on entering a breakout move: look for periods of price consolidation, look to enter the stock as it trades up through the resistance level, and look for a surge in volume to confirm the entry. This is a solid approach used by hundreds of thousands of successful traders, money managers, hedge fund managers through the world, and for good reason, because it works. This entry method for this style of trading is a hardy and reliable method that has a long history of success for those with the discipline to use it. There may be slight derivations of the steps, such as the percentage of volume surge to confirm the breakout or others, but the principle behind the steps remains the same. The problem a trader faces is when price action doesn't necessarily result in a step-by-step, cookie-cutter approach and it explodes way above the resistance level or lacks the volume to confirm but the stock breaks away anyway. You can have a great method and plan of entry but when the unexpected happens, even the best of plans prove worthless. |

|
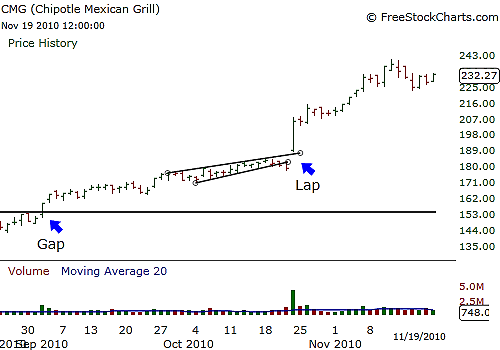
| FIGURE 1: CMG. CMG both exhibited strong moves after signaling entries with a gap on September 1, 2010, and a lap on October 22, 2010. |
| Graphic provided by: www.freestockcharts.com. |
| |
| In his book, The Hedge Fund Edge, author Mark Boucher unveils a study of price patterns that occurred during a breakout move. One was the traditional breakout entry method just described, but there were two others that were referred to as the "gap" and the "lap." A gap pattern, as defined in his book, was a price pattern where a daily price bar opened higher than the previous daily price bar's price close but within its trading range. A lap pattern was defined as a daily price bar opening higher than both the previous daily price bar's close and trading range. See Figure 1. |
| The one distinct difference that these two patterns had over the traditional method was that they did not require a surge in above-average volume or the previous trading day's volume in order to confirm an entry. The only requirement was that the market be in a bullish trend and the stock being traded had consolidated in a tight trading range for four to six weeks. To understand how both of these patterns can be added and used as part of an effective entry method for breakout moves, spend some time going over your stock charts, looking for a tight trading range of four to six weeks, and observe the price action just before the stock traded higher. Identify which pattern leads the move upward and you'll begin to train your eye to take advantage of these moves without missing opportunities because you get caught flat-footed without a backup plan. |
Billy Williams has been trading the markets for 27 years, specializing in momentum trading with stocks and options.
| Company: | StockOptionSystem.com |
| E-mail address: | stockoptionsystem.com@gmail.com |
Traders' Resource Links | |
| StockOptionSystem.com has not added any product or service information to TRADERS' RESOURCE. | |
Click here for more information about our publications!
PRINT THIS ARTICLE

Request Information From Our Sponsors
- StockCharts.com, Inc.
- Candle Patterns
- Candlestick Charting Explained
- Intermarket Technical Analysis
- John Murphy on Chart Analysis
- John Murphy's Chart Pattern Recognition
- John Murphy's Market Message
- MurphyExplainsMarketAnalysis-Intermarket Analysis
- MurphyExplainsMarketAnalysis-Visual Analysis
- StockCharts.com
- Technical Analysis of the Financial Markets
- The Visual Investor
- VectorVest, Inc.
- Executive Premier Workshop
- One-Day Options Course
- OptionsPro
- Retirement Income Workshop
- Sure-Fire Trading Systems (VectorVest, Inc.)
- Trading as a Business Workshop
- VectorVest 7 EOD
- VectorVest 7 RealTime/IntraDay
- VectorVest AutoTester
- VectorVest Educational Services
- VectorVest OnLine
- VectorVest Options Analyzer
- VectorVest ProGraphics v6.0
- VectorVest ProTrader 7
- VectorVest RealTime Derby Tool
- VectorVest Simulator
- VectorVest Variator
- VectorVest Watchdog
