HOT TOPICS LIST
- MACD
- Fibonacci
- RSI
- Gann
- ADXR
- Stochastics
- Volume
- Triangles
- Futures
- Cycles
- Volatility
- ZIGZAG
- MESA
- Retracement
- Aroon
INDICATORS LIST
LIST OF TOPICS
PRINT THIS ARTICLE
by Koos van der Merwe
Horizon BetaPro S&P/TSX 60 Bull ETF offers a daily investment equal to 200% the daily performance of the S&P/TSX60 Index before fees and expenses. Good deal?
Position: Buy
Koos van der Merwe
Has been a technical analyst since 1969, and has worked as a futures and options trader with First Financial Futures in Johannesburg, South Africa.
PRINT THIS ARTICLE
OSCILLATORS
Trading The ETF Horizon S&P TSX 60
11/23/10 08:31:05 AMby Koos van der Merwe
Horizon BetaPro S&P/TSX 60 Bull ETF offers a daily investment equal to 200% the daily performance of the S&P/TSX60 Index before fees and expenses. Good deal?
Position: Buy
| The HBP 60 Bull takes positions in financial instruments and/or equity securities to seek daily investment results, before fees and expenses, that correspond to twice the daily performance or inverse daily of the S&P/TSX 60 Index. They are rebalanced daily, so their risk is limited to the initial invested capital. As a result, 200% benchmark tracking over a longer period is dependent upon the extent of compounding and the underlying benchmark volatility. |

|
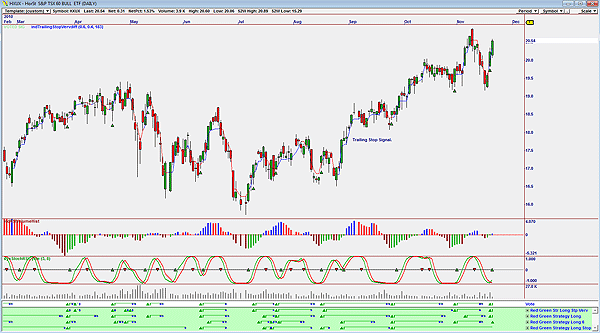
| FIGURE 1: HORIZON BULL S&P/TSX 60, DAILY |
| Graphic provided by: OmniTrader. |
| |
| Figure 1 is an OmniTrader chart with the red green strategy I prefer to use to trade stocks. I use a trailing-stop signal to take me out of the trading position. Note how often the strategy gives a buy signal and how often it is stopped out by the trailing-stop signal. The basic red green strategy gives a buy signal when the close price of a share is greater than the high price of 10 days ago, and a sell price when the close price is less than the low of six days ago. However, for trading the Horizon Beta Pro exchange traded funds (ETFs), I have changed the strategy so that a buy signal is given when the close price is greater than the low of six days ago. The two indicators shown on the chart, the relative strength index (RSI) volume histogram and the stochastic RSI cycle indicator are confirmation indicators. |
| Finally, do note that this strategy is a short-term trading strategy only, not a long-term investing strategy. |
Has been a technical analyst since 1969, and has worked as a futures and options trader with First Financial Futures in Johannesburg, South Africa.
| Address: | 3256 West 24th Ave |
| Vancouver, BC | |
| Phone # for sales: | 6042634214 |
| E-mail address: | petroosp@gmail.com |
Click here for more information about our publications!
Comments
Date: 12/01/10Rank: 5Comment: Good call.
Dick Slayton

Request Information From Our Sponsors
- VectorVest, Inc.
- Executive Premier Workshop
- One-Day Options Course
- OptionsPro
- Retirement Income Workshop
- Sure-Fire Trading Systems (VectorVest, Inc.)
- Trading as a Business Workshop
- VectorVest 7 EOD
- VectorVest 7 RealTime/IntraDay
- VectorVest AutoTester
- VectorVest Educational Services
- VectorVest OnLine
- VectorVest Options Analyzer
- VectorVest ProGraphics v6.0
- VectorVest ProTrader 7
- VectorVest RealTime Derby Tool
- VectorVest Simulator
- VectorVest Variator
- VectorVest Watchdog
- StockCharts.com, Inc.
- Candle Patterns
- Candlestick Charting Explained
- Intermarket Technical Analysis
- John Murphy on Chart Analysis
- John Murphy's Chart Pattern Recognition
- John Murphy's Market Message
- MurphyExplainsMarketAnalysis-Intermarket Analysis
- MurphyExplainsMarketAnalysis-Visual Analysis
- StockCharts.com
- Technical Analysis of the Financial Markets
- The Visual Investor
