HOT TOPICS LIST
- MACD
- Fibonacci
- RSI
- Gann
- ADXR
- Stochastics
- Volume
- Triangles
- Futures
- Cycles
- Volatility
- ZIGZAG
- MESA
- Retracement
- Aroon
INDICATORS LIST
LIST OF TOPICS
PRINT THIS ARTICLE
by Donald W. Pendergast, Jr.
After every sharp selloff, it's normal to see a reaction move higher into resistance areas. The silver futures market may be at such a juncture at this moment.
Position: Sell
Donald W. Pendergast, Jr.
Donald W. Pendergast is a financial markets consultant who offers specialized services to stock brokers and high net worth individuals who seek a better bottom line for their portfolios.
PRINT THIS ARTICLE
DETREND PRICE OSCILL
Silver Reaction Rally Nearing Detrend Extreme
11/19/10 02:36:16 PMby Donald W. Pendergast, Jr.
After every sharp selloff, it's normal to see a reaction move higher into resistance areas. The silver futures market may be at such a juncture at this moment.
Position: Sell
| The silver futures market appeared nearly unstoppable only two short weeks ago, seemingly on a single-minded mission to take out the magical $30 price barrier, a valuation zone that the precious metal hadn't seen in nearly 31 years. Prices stalled just shy of the $30 mark, however, resulting in a swift selloff down toward $25. Now this super volatile market is on the move again, at $27.360 as I write this on November 18 evening. For silver traders, the big question is this: Does this rally higher mean that the bull market is intact, or is this just a sucker rally (either a bearish wave 2 or bearish wave B in Elliott wave parlance)? Bull market or bear, let's take a quick look and see if we can't at least come up with a useful short-term analysis for the mini-silver futures (YIZ10) market. |

|
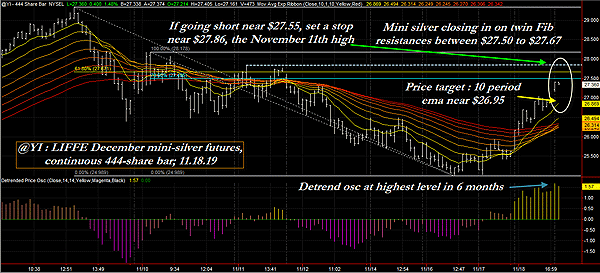
| FIGURE 1: MINI SILVER. Some combinations of technical indicators can yield powerful results, especially when evaluated in the context of the larger, big-picture trend of a given market. When a stock or futures contract approaches key Fibonacci support/resistance confluence levels at the same time that the detrend oscillator is at extremely extended readings, it can be a good time to start calculating the risk-reward ratios (RR) of various trade setups. The setup above, should it trigger, yields a RR of better than 1.90 to 1. |
| Graphic provided by: TradeStation. |
| |
| Figure 1 is a 444-volume share bar chart for LIFFE December mini-silver futures (YIZ10); note the minor intraday double bottom pattern near $25.00, a clue that the market was ready to perhaps launch its expected reaction move higher. Launch higher it did, with prices vaulting right across the complete array of moving average ribbons (standard in TradeStation 8.7 and newer). For the bulls, a very hopeful sign of strength, indeed. However, mini-silver is going to have to deal with a Fibonacci confluence resistance area between $27.50 to $27.67 at the same time that the detrend oscillator (set at 14 periods) is already stretched to its highest extreme reading of the last six months. If you see mini-silver make it to either of those Fib numbers on the current upswing, look for a low-risk short sale down toward the nearest moving average of the ribbon (a 10-period exponential moving average [EMA] should do just as well), using the November 11, 2010, intraday high of $27.84 plus a tick (or two) as your stop loss. if you go short near $27.55 and use the 10-period EMA as your moving price target (projected to be near $26.95 at the current rate of trajectory with mini-silver at $27.55), the trade will sport a nominal risk to reward ratio of about 1.93 to one, which is very good for a short-term intraday reversal play. And since this reaction rally is hitting such powerful resistance areas in the midst of what may yet turn out to be a major bearish reversal (one that began 10 days ago with silver close to $30), this short setup is a fairly straightforward, stress-free proposal -- if you strictly adhere to the use of a fixed, nonnegotiable stop-loss, as mentioned. |
| Silver bull, silver bear, or silver funk -- who cares? Learn to read the charts using the detrend oscillator in conjunction with key Fibonacci confluence support and resistance levels to help improve your timing in the silver market, no matter what time frame you prefer to trade. |
Donald W. Pendergast is a financial markets consultant who offers specialized services to stock brokers and high net worth individuals who seek a better bottom line for their portfolios.
| Title: | Writer, market consultant |
| Company: | Linear Trading Systems LLC |
| Jacksonville, FL 32217 | |
| Phone # for sales: | 904-239-9564 |
| E-mail address: | lineartradingsys@gmail.com |
Traders' Resource Links | |
| Linear Trading Systems LLC has not added any product or service information to TRADERS' RESOURCE. | |
Click here for more information about our publications!
Comments
Date: 11/23/10Rank: 4Comment:

|

Request Information From Our Sponsors
- StockCharts.com, Inc.
- Candle Patterns
- Candlestick Charting Explained
- Intermarket Technical Analysis
- John Murphy on Chart Analysis
- John Murphy's Chart Pattern Recognition
- John Murphy's Market Message
- MurphyExplainsMarketAnalysis-Intermarket Analysis
- MurphyExplainsMarketAnalysis-Visual Analysis
- StockCharts.com
- Technical Analysis of the Financial Markets
- The Visual Investor
- VectorVest, Inc.
- Executive Premier Workshop
- One-Day Options Course
- OptionsPro
- Retirement Income Workshop
- Sure-Fire Trading Systems (VectorVest, Inc.)
- Trading as a Business Workshop
- VectorVest 7 EOD
- VectorVest 7 RealTime/IntraDay
- VectorVest AutoTester
- VectorVest Educational Services
- VectorVest OnLine
- VectorVest Options Analyzer
- VectorVest ProGraphics v6.0
- VectorVest ProTrader 7
- VectorVest RealTime Derby Tool
- VectorVest Simulator
- VectorVest Variator
- VectorVest Watchdog
