HOT TOPICS LIST
- MACD
- Fibonacci
- RSI
- Gann
- ADXR
- Stochastics
- Volume
- Triangles
- Futures
- Cycles
- Volatility
- ZIGZAG
- MESA
- Retracement
- Aroon
INDICATORS LIST
LIST OF TOPICS
PRINT THIS ARTICLE
by Billy Williams
Triple-bottom patterns are one of the highest-performing reversal patterns you can trade if you know how.
Position: Hold
Billy Williams
Billy Williams has been trading the markets for 27 years, specializing in momentum trading with stocks and options.
PRINT THIS ARTICLE
CHART ANALYSIS
How To Spot And Trade A Bullish Triple-Bottom Pattern
11/19/10 09:24:04 AMby Billy Williams
Triple-bottom patterns are one of the highest-performing reversal patterns you can trade if you know how.
Position: Hold
| At some point, a bullish trend in the market will suffer a downtrend and the question becomes, "How far will it go down and how will I know when the market has bottomed?" Traders have come to rely on methods such as Fibonacci retracements, but a closer look reveals that these types of retracements can only show us how far a decline has actually occurred during the last leg of price action and not the bottom of the decline itself. However, one of the most effective ways in technical analysis for determining the bottom is studying chart patterns, particularly triple-bottom patterns. These types of patterns are a type of bullish reversal pattern where it is revealed to be a strong level of price support, occurring after a downtrend. |

|
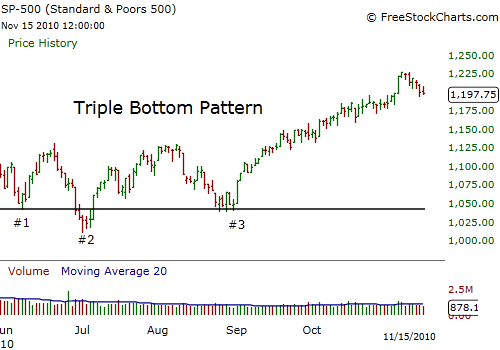
| FIGURE 1: S&P 500, MONTHLY. This triple-bottom pattern formed over two months in the S&P 500 from the price low of June 8, 2010, to its breakout to the upside on September 20, 2010. |
| Graphic provided by: www.freestockcharts.com. |
| |
| The first bottom is revealed after price experiences a steady decline, making a significant low in price action. This can sometimes be spotted with the help of trade volume spiking higher at or near the price low. The rise in trade volume can help you identify when the decline is exhausted and also when momentum begins to shift back to the upside. The second bottom results when the momentum shift back to the upside fails and attempts to trade back down through the previous low. This move can be accompanied by higher trade volume at or near the previous price low, which, again, should find support at that price level, shifting the momentum back to the upside as bulls try to take control of the price action again. |
| The third bottom forms when the bulls fail once more to take control of the price action, causing price to fall back to a confirmed level of price support by the first and second bottoms. At this level, a spike in trade volume is unlikely, though not out of the question, since support is established. However, as price drifts upward once more, then look for bulls to take control of the trend near the previous highs set in price. These previous highs mark resistance levels where the bulls previously failed to take control of the trend before price rolled over to test the price lows previously. Look for price to break out above resistance on higher volume confirming a reversal in price to the upside from the previous downtrend. On June 8, 2010, the Standard & Poor's 500 experienced a decline in price where a price low was made on this date. Then price shifted back to the upside where on June 21, 2010, the bulls failed to take control of the uptrend and momentum shifted back to the downside. Price continued to decline to the previous price low made on June 8, 2010, but on July 1, 2010, found support near the previous price low, trading back to the upside. |
| Once more, bulls failed to follow through, and August 9, 2010, near the previous high on June 21, 2010, momentum shifted back down to the confirmed price support level set on June 8 and July 1. On August 27, 2010, the third bottom forms and this time bulls take control of the S&P as the market rallies to where it is currently. Agressive traders can go long near the low of the third bottom, while conservative traders can wait for price to break higher through the resistance level in price. |
Billy Williams has been trading the markets for 27 years, specializing in momentum trading with stocks and options.
| Company: | StockOptionSystem.com |
| E-mail address: | stockoptionsystem.com@gmail.com |
Traders' Resource Links | |
| StockOptionSystem.com has not added any product or service information to TRADERS' RESOURCE. | |
Click here for more information about our publications!
PRINT THIS ARTICLE

Request Information From Our Sponsors
- StockCharts.com, Inc.
- Candle Patterns
- Candlestick Charting Explained
- Intermarket Technical Analysis
- John Murphy on Chart Analysis
- John Murphy's Chart Pattern Recognition
- John Murphy's Market Message
- MurphyExplainsMarketAnalysis-Intermarket Analysis
- MurphyExplainsMarketAnalysis-Visual Analysis
- StockCharts.com
- Technical Analysis of the Financial Markets
- The Visual Investor
- VectorVest, Inc.
- Executive Premier Workshop
- One-Day Options Course
- OptionsPro
- Retirement Income Workshop
- Sure-Fire Trading Systems (VectorVest, Inc.)
- Trading as a Business Workshop
- VectorVest 7 EOD
- VectorVest 7 RealTime/IntraDay
- VectorVest AutoTester
- VectorVest Educational Services
- VectorVest OnLine
- VectorVest Options Analyzer
- VectorVest ProGraphics v6.0
- VectorVest ProTrader 7
- VectorVest RealTime Derby Tool
- VectorVest Simulator
- VectorVest Variator
- VectorVest Watchdog
