HOT TOPICS LIST
- MACD
- Fibonacci
- RSI
- Gann
- ADXR
- Stochastics
- Volume
- Triangles
- Futures
- Cycles
- Volatility
- ZIGZAG
- MESA
- Retracement
- Aroon
INDICATORS LIST
LIST OF TOPICS
PRINT THIS ARTICLE
by Ranjan Jha, CMT
Price and volume action of TLT shows it's ready to reverse its short-term downtrend.
Position: N/A
Ranjan Jha, CMT
I am a member of the Market Technicians Association and manage a limited partnership investment club in Virginia. Always seek advice from your own Financial Advisor before acting on any method outlined here since every circumstance is different.
PRINT THIS ARTICLE
CHART ANALYSIS
TLT May Change Direction
11/18/10 01:01:47 PMby Ranjan Jha, CMT
Price and volume action of TLT shows it's ready to reverse its short-term downtrend.
Position: N/A
| On August 25, 2010, iShares Barclays 20+ Year Treasury Bond ETF (TLT) made an intraday high of 109.34. Since then, it has been in a short-term downtrend. The latest low point of 93.81 was made intraday on November 15. That's a corrective move of more than 14%. Since that low, the subsequent price and volume action shows strong resistance to downward pressure. |
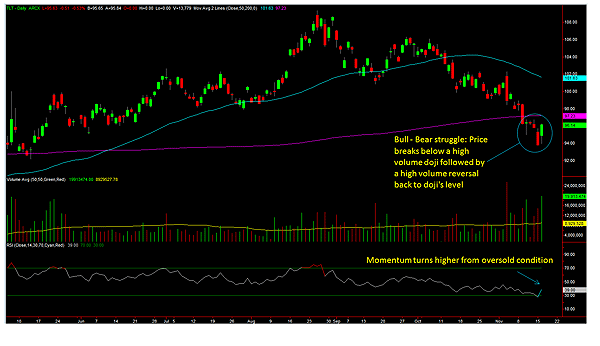
| Figure 1 shows a daily candlestick chart of TLT. On November 10, TLT ended the day with a high-volume doji and ended unchanged near the closing price of the previous day. For the next three days, the bears managed to push price below the low of the doji, but on November 16, the price reversed back to the closing price of the doji of November 10 on relatively high volume. This indicates that some bulls have begun to fight the bear trend, or some sizable short-covering is going on. |

|
| FIGURE 1: iSHARES BARCLAYS 20+ YEAR TREASURY BOND ETF (TLT), DAILY. The recent downtrend appears to be reversing. |
| Graphic provided by: TradeStation. |
| |
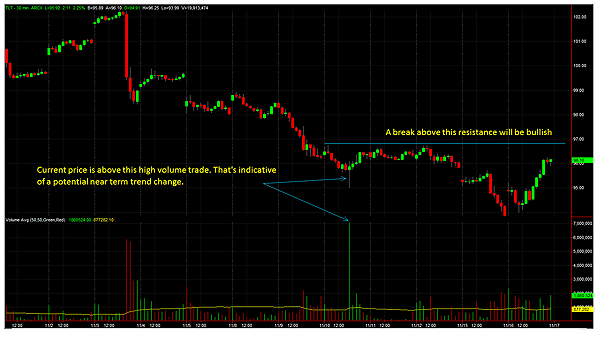
| To confirm that, let's look at intraday price action shown in Figure 2. This 30-minute chart shows a spike in volume on November 10, where nearly seven million shares changed hands in a 30-minute period. This was a large transaction, considering the average daily volume for this exchange traded fund (ETF) is a little under nine million shares. The current price holds above the price of that large transaction near $96. In addition, TLT is showing a consolidation pattern just below 97. |

|
| FIGURE 2: iSHARES BARCLAYS 20+ YEAR TREASURY BOND ETF (TLT), INTRADAY. Price action shows a base formation. |
| Graphic provided by: TradeStation. |
| |
| If the price continues to pull above that level on relatively higher volume, then it will indicate that players with bigger purchasing power are changing their minds about this downtrend. A break above $97 will clearly indicate that at least short positions should be considerably reduced. |
I am a member of the Market Technicians Association and manage a limited partnership investment club in Virginia. Always seek advice from your own Financial Advisor before acting on any method outlined here since every circumstance is different.
| Address: | 2039 Stone Mill Drive |
| Salem, VA 24153 | |
| Phone # for sales: | 540-330-2911 |
| E-mail address: | ranjanjha@hotmail.com |
Click here for more information about our publications!
Comments
Date: 11/23/10Rank: 4Comment:

|

Request Information From Our Sponsors
- StockCharts.com, Inc.
- Candle Patterns
- Candlestick Charting Explained
- Intermarket Technical Analysis
- John Murphy on Chart Analysis
- John Murphy's Chart Pattern Recognition
- John Murphy's Market Message
- MurphyExplainsMarketAnalysis-Intermarket Analysis
- MurphyExplainsMarketAnalysis-Visual Analysis
- StockCharts.com
- Technical Analysis of the Financial Markets
- The Visual Investor
- VectorVest, Inc.
- Executive Premier Workshop
- One-Day Options Course
- OptionsPro
- Retirement Income Workshop
- Sure-Fire Trading Systems (VectorVest, Inc.)
- Trading as a Business Workshop
- VectorVest 7 EOD
- VectorVest 7 RealTime/IntraDay
- VectorVest AutoTester
- VectorVest Educational Services
- VectorVest OnLine
- VectorVest Options Analyzer
- VectorVest ProGraphics v6.0
- VectorVest ProTrader 7
- VectorVest RealTime Derby Tool
- VectorVest Simulator
- VectorVest Variator
- VectorVest Watchdog
