HOT TOPICS LIST
- MACD
- Fibonacci
- RSI
- Gann
- ADXR
- Stochastics
- Volume
- Triangles
- Futures
- Cycles
- Volatility
- ZIGZAG
- MESA
- Retracement
- Aroon
INDICATORS LIST
LIST OF TOPICS
PRINT THIS ARTICLE
by Koos van der Merwe
A few days ago, I wrote an article titled "What Now, Dow? Looking For Our Strategy." I am starting to believe that I was too conservative in my forecasts.
Position: Buy
Koos van der Merwe
Has been a technical analyst since 1969, and has worked as a futures and options trader with First Financial Futures in Johannesburg, South Africa.
PRINT THIS ARTICLE
ELLIOTT WAVE
Are My Elliott Wave Counts Too Conservative? You Decide
11/18/10 08:32:08 AMby Koos van der Merwe
A few days ago, I wrote an article titled "What Now, Dow? Looking For Our Strategy." I am starting to believe that I was too conservative in my forecasts.
Position: Buy
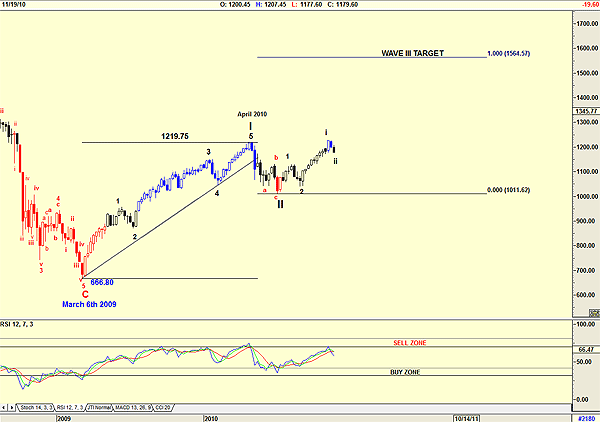
| The more I study my charts, the more I am beginning to think that I am wrong in my Elliott wave count submitted in the article I wrote a few days ago. When I study the Standard & Poor's 500, I realize that I was much too conservative. My chart in that earlier article was that of the Dow Jones Industrial Average (DJIA). Figure 1 is a weekly chart of the Standard & Poor's 500. |

|
| FIGURE 1: S&P 500, WEEKLY |
| Graphic provided by: AdvancedGET. |
| |
| When I study my wave counts, I see that Wave III should be far higher than the target I suggested in that article. Wave III should be greater than Wave I, which means that at the least the target for Wave III should be 1571.76. The length of Wave I was 552.95 (1219.75 - 666.80 = 552.95). This means that the target for Wave III is 1564.97 (1011.62 + 552.95 = 1564.97), as shown. If this is true, then it means that the present correction is not a Wave 3 of Wave III, but a wave i of Wave 3 of Wave III. Complicated? You bet, but Elliott wave should be simple, never complicated, and with the relative strength index (RSI)(12) as shown on the weekly chart, not in the sell zone, I can only believe that this must be the case. Remember, Elliott wave theory says that should Wave III be less than Wave I, then Wave V will be less than Wave III. This is a complicated pattern, and I have only seen this pattern twice in all the years I have practiced wave theory (since 1969). So I am seriously starting to believe that the S&P 500 is tracing a wave ii of Wave 3 of Wave III, and this means that there is a strong bull market ahead of us. |

|
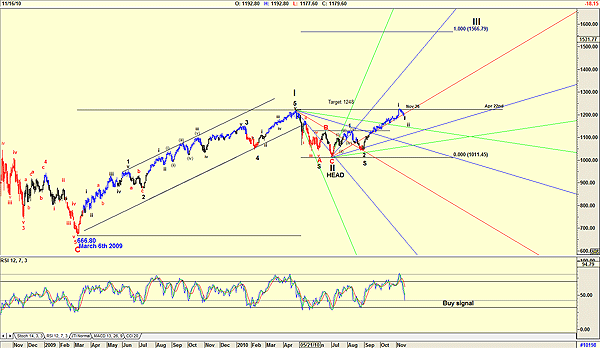
| FIGURE 2: S&P 500, DAILY |
| Graphic provided by: AdvancedGET. |
| |
| A look at the Gann fans on a daily chart (Figure 2) is suggesting two dates, November 26 and April 22. November 26 is just around the corner, so I am inclined to feel that this date could be the bottom of wave ii. April 22 could possibly be the top of Wave III, yet even that seems too close, but for the moment I will go with that. To conclude, in my previous article, I suggested that the market is in a bull market. I just underestimated its strength. |
Has been a technical analyst since 1969, and has worked as a futures and options trader with First Financial Futures in Johannesburg, South Africa.
| Address: | 3256 West 24th Ave |
| Vancouver, BC | |
| Phone # for sales: | 6042634214 |
| E-mail address: | petroosp@gmail.com |
Click here for more information about our publications!
Comments
Date: 11/18/10Rank: 5Comment: Koos:
You have been right on so far. I hope you continue your success. Blessings,
Dick Slayton

|

Request Information From Our Sponsors
- StockCharts.com, Inc.
- Candle Patterns
- Candlestick Charting Explained
- Intermarket Technical Analysis
- John Murphy on Chart Analysis
- John Murphy's Chart Pattern Recognition
- John Murphy's Market Message
- MurphyExplainsMarketAnalysis-Intermarket Analysis
- MurphyExplainsMarketAnalysis-Visual Analysis
- StockCharts.com
- Technical Analysis of the Financial Markets
- The Visual Investor
- VectorVest, Inc.
- Executive Premier Workshop
- One-Day Options Course
- OptionsPro
- Retirement Income Workshop
- Sure-Fire Trading Systems (VectorVest, Inc.)
- Trading as a Business Workshop
- VectorVest 7 EOD
- VectorVest 7 RealTime/IntraDay
- VectorVest AutoTester
- VectorVest Educational Services
- VectorVest OnLine
- VectorVest Options Analyzer
- VectorVest ProGraphics v6.0
- VectorVest ProTrader 7
- VectorVest RealTime Derby Tool
- VectorVest Simulator
- VectorVest Variator
- VectorVest Watchdog
