

HOT TOPICS LIST
- MACD
- Fibonacci
- RSI
- Gann
- ADXR
- Stochastics
- Volume
- Triangles
- Futures
- Cycles
- Volatility
- ZIGZAG
- MESA
- Retracement
- Aroon
INDICATORS LIST
LIST OF TOPICS
PRINT THIS ARTICLE
by Alan R. Northam
Linear regression analysis shows that Financial Select SPDR ETF is in a long-term downtrend.
Position: N/A
Alan R. Northam
Alan Northam lives in the Dallas, Texas area and as an electronic engineer gave him an analytical mind from which he has developed a thorough knowledge of stock market technical analysis. His abilities to analyze the future direction of the stock market has allowed him to successfully trade of his own portfolio over the last 30 years. Mr. Northam is now retired and trading the stock market full time. You can reach him at inquiry@tradersclassroom.com or by visiting his website at http://www.tradersclassroom.com. You can also follow him on Twitter @TradersClassrm.
PRINT THIS ARTICLE
LINEAR REG CHANNEL
XLF In Long-Term Downtrend
11/17/10 01:29:34 PMby Alan R. Northam
Linear regression analysis shows that Financial Select SPDR ETF is in a long-term downtrend.
Position: N/A
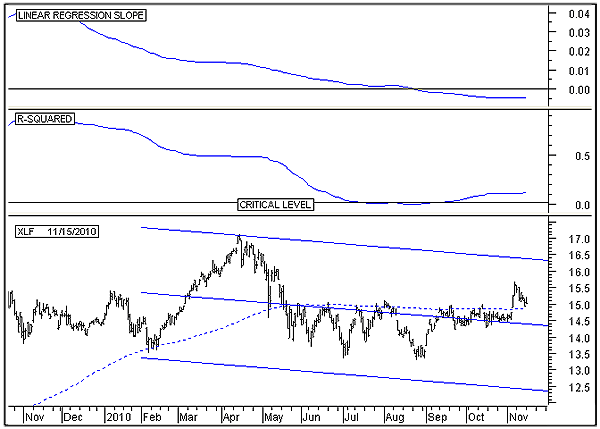
| Figure 1 is the 200-day linear regression channel representing the long-term trend of Financial Select SPDR ETF (XLF). The bottom panel shows the daily price bars over the last 12 months. This panel also shows the linear regression channel with the middle line being the linear regression line. The dotted blue line is the 200-day simple moving average (SMA) added for reference. The top panel is the linear regression slope indicator and measures the slope of the linear regression line and represents the direction of the price trend. When the linear regression slope indicator crosses below zero, it indicates that the price trend is in the downward direction. The second panel is the R-squared indicator and measures the strength of the trend. Note the horizontal line. This line represents the critical Level. When the R-squared indicator moves above the critical level, there exists a 95% probability that the trend will remain in motion. The critical level moves higher or lower, depending upon the length of linear regression line being used. For shorter periods, the critical level moves higher, and for longer periods, it moves downward. The R-squared indicator also measures the strength of the trend and when it moves in the upward direction, it indicates that the direction of the trend is increasing in strength. Over the long term, Figure 1 shows that XLF is in a downtrend and that this downtrend is becoming stronger. |
|
| FIGURE 1: XLF, DAILY. This chart shows the 200 day linear regression channel drawn on the price chart in the bottom panel, the linear regression slope indicator in the top panel, and the R-squared indicator in the middle panel. |
| Graphic provided by: MetaStock. |
| |
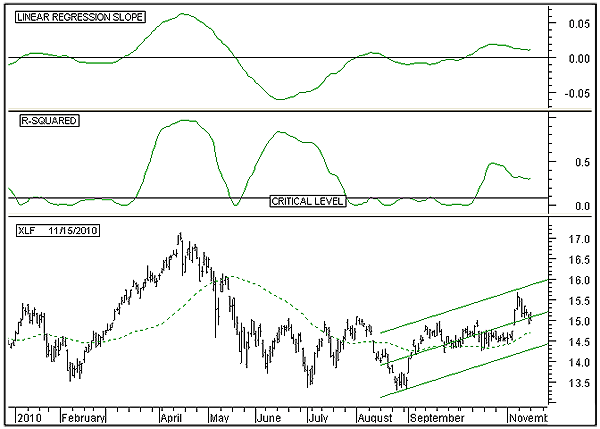
| Figure 2 is the 50-day linear regression channel of XLF and represents the intermediate-term time frame. The bottom panel shows the daily price bars and the linear regression channel from the beginning of 2010. The dotted green line is the 50-day SMA added for reference. The top panel is the linear regression slope indicator indicating that price is in an uptrend. Note, however, that this indicator is moving in a downward direction but is still above its zero line, indicating that price is now decelerating. Price deceleration normally occurs just prior to a reversal in direction and is part of the topping process. The next panel is the R-squared indicator and measures the strength of the trend. This indicator is also moving lower, indicating a weakening of the uptrend. Over the intermediate term, Figure 2 shows that XLF is in a weakening uptrend. |
|
| FIGURE 2: XLF, DAILY. This chart shows the 50-day linear regression channel drawn on the price chart in the bottom panel, the linear regression slope indicator in the top panel, and the R-squared indicator in the middle panel. |
| Graphic provided by: MetaStock. |
| |
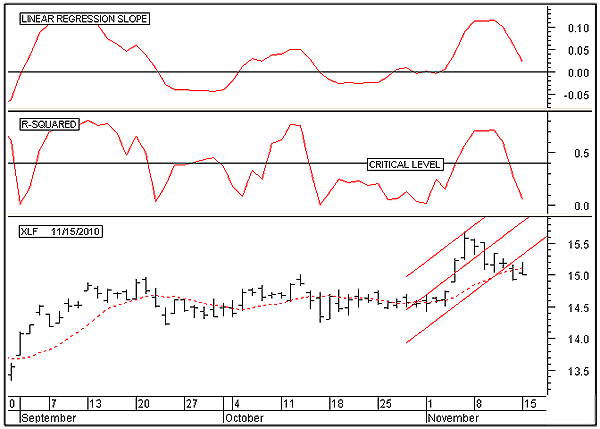
| Figure 3 is the 10-day linear regression channel of XLF and represents the short-term time frame. The bottom panel shows the daily price bars and the linear regression channel over the last three months. The dotted red line is the 10-day SMA added for reference. The bottom panel shows the daily price bars and the 10-day linear regression channel. Note that the price bars have now broken down below the lower channel line and indicates that the uptrend has ended but does not necessarily indicate that a new downtrend has started, as price could simply just start moving sideways. The top panel is the linear regression slope indicator and indicates the direction of the trend. Note that this indicator is still above the zero line, indicating that the short-term trend has not yet reversed to the downside. A move below the zero line will signal that price has entered into a short-term downtrend. The next panel is the R-squared indicator and measures the strength of the trend. This indicator is now below its critical level and indicates a lack of a significant trend. As long as this indicator remains below its critical level, it indicates a high probability that price will enter into a sideways trading range over the short term. Overall, Figure 3 shows that the short-term uptrend has ended, but a new downtrend has not yet developed. |
|
| FIGURE 3: XLF, DAILY. This chart shows the 10-day linear regression channel drawn on the price chart in the bottom panel, the linear regression slope indicator in the top panel, and the R-squared indicator in the middle panel. |
| Graphic provided by: MetaStock. |
| |
| In conclusion, the Financial Select SPDR ETF (XLF) is in an established long-term downtrend. Within this downward trend price has been moving upward, over the intermediate term, toward the long-term upper linear regression channel line. However, this intermediate-term upward rally seems to be running out of steam, as noted by price having broken down below the short-term linear regression channel. As a result, this analysis shows there is a high-probability that XLF is ready to start moving lower over the intermediate term, but this reversal in direction from up to down has not yet taken place. |
Alan Northam lives in the Dallas, Texas area and as an electronic engineer gave him an analytical mind from which he has developed a thorough knowledge of stock market technical analysis. His abilities to analyze the future direction of the stock market has allowed him to successfully trade of his own portfolio over the last 30 years. Mr. Northam is now retired and trading the stock market full time. You can reach him at inquiry@tradersclassroom.com or by visiting his website at http://www.tradersclassroom.com. You can also follow him on Twitter @TradersClassrm.
| Garland, Tx | |
| Website: | www.tradersclassroom.com |
| E-mail address: | inquiry@tradersclassroom.com |
Click here for more information about our publications!
PRINT THIS ARTICLE

Request Information From Our Sponsors
- StockCharts.com, Inc.
- Candle Patterns
- Candlestick Charting Explained
- Intermarket Technical Analysis
- John Murphy on Chart Analysis
- John Murphy's Chart Pattern Recognition
- John Murphy's Market Message
- MurphyExplainsMarketAnalysis-Intermarket Analysis
- MurphyExplainsMarketAnalysis-Visual Analysis
- StockCharts.com
- Technical Analysis of the Financial Markets
- The Visual Investor
- VectorVest, Inc.
- Executive Premier Workshop
- One-Day Options Course
- OptionsPro
- Retirement Income Workshop
- Sure-Fire Trading Systems (VectorVest, Inc.)
- Trading as a Business Workshop
- VectorVest 7 EOD
- VectorVest 7 RealTime/IntraDay
- VectorVest AutoTester
- VectorVest Educational Services
- VectorVest OnLine
- VectorVest Options Analyzer
- VectorVest ProGraphics v6.0
- VectorVest ProTrader 7
- VectorVest RealTime Derby Tool
- VectorVest Simulator
- VectorVest Variator
- VectorVest Watchdog