HOT TOPICS LIST
- MACD
- Fibonacci
- RSI
- Gann
- ADXR
- Stochastics
- Volume
- Triangles
- Futures
- Cycles
- Volatility
- ZIGZAG
- MESA
- Retracement
- Aroon
INDICATORS LIST
LIST OF TOPICS
PRINT THIS ARTICLE
by Billy Williams
Candlestick patterns such as the bullish doji can you help you spot where buyers are and where low-risk entries are.
Position: Hold
Billy Williams
Billy Williams has been trading the markets for 27 years, specializing in momentum trading with stocks and options.
PRINT THIS ARTICLE
CANDLESTICK CHARTING
How To Identify And Trade Bullish Dojis
11/17/10 01:18:39 PMby Billy Williams
Candlestick patterns such as the bullish doji can you help you spot where buyers are and where low-risk entries are.
Position: Hold
| Chart patterns help traders spot formations in the market where price action is taking shape to begin either an upward or downward move. Typically, a trader waits for the move to confirm its intentions by trading on higher volume while trading through the constraints of the chart pattern at the same time. This is effective but it takes a great deal of focus and patience while waiting for price action to make its move as well as for trade volume to confirm its validity. However, using individual price bars can help signal where the formation of the pattern is occurring as well as offer up some low-risk entry points for profitable trading. |

|
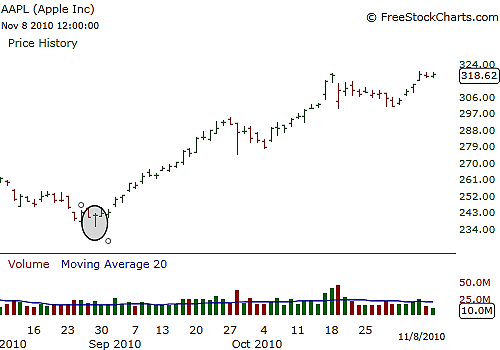
| FIGURE 1: AAPL. This bullish doji signaled the end of a price pullback near support and ran up almost 90 points from this price bar. |
| Graphic provided by: www.freestockcharts.com. |
| |
| For example, using support and resistance levels in a stock's chart is one of the tried-and-true methods for effective trading with many stock traders using this as their sole method of trading the market or a close proximity. While chart patterns form around support and resistance levels, such as flat base patterns, price bar patterns such as the doji help reveal to a skilled trader exactly where support and resistance actually is on a stock chart. See Figure 1. The doji is a name given to a price bar in candlestick charting where both the open and close of that bar is even or near even. Dojis come in a variety of micropatterns dependent on where the open and close reside. |

|
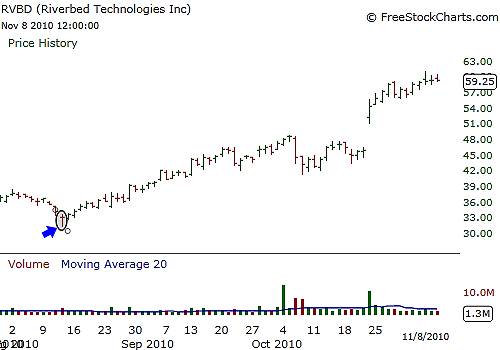
| FIGURE 2: RVBD. This bullish doji formed on a level of support in RVDB, running up more than 25 points from this price bar. |
| Graphic provided by: www.freestockcharts.com. |
| |
| Bullish dojis will have an open and close in price where they appear near the upper end of their daily trading range, leaving a long tail at the bottom of their range. This type of doji is common in a bullish trend where the stock has declined in price but then a bullish doji appears near the bottom of the decline. See Figure 2. This occurs because as the stock opens, it will decline to a level where buyers begin to step in, buying on the dip in price. As they begin to accumulate shares, this forces the price action back in the upper range of the daily price bar, forming a tail at the bottom portion of the daily trading range. Ultimately, as the day's trading comes to a close, the price of the stock closes near or close to the day's open. |
| Forming a doji like this when taking into account the context of the state of the market itself, or, in this case, an upward trend can signal that pressure is building to the upside. This upward pressure can be exploited by a low-risk entry at the top of the bullish doji to catch the trend as it resumes its uptrend. The easiest way to learn how to trade dojis is to look for a particular type, such as a bullish doji, and go back through a series of charts with different stocks and spot where in the price action they begin to form. By scanning through charts in this manner, you begin to train your eye to spot them and how they set up, revealing new low-risk trading opportunities to profit from within the market. |
Billy Williams has been trading the markets for 27 years, specializing in momentum trading with stocks and options.
| Company: | StockOptionSystem.com |
| E-mail address: | stockoptionsystem.com@gmail.com |
Traders' Resource Links | |
| StockOptionSystem.com has not added any product or service information to TRADERS' RESOURCE. | |
Click here for more information about our publications!
Comments
Date: 11/23/10Rank: 5Comment:

Request Information From Our Sponsors
- StockCharts.com, Inc.
- Candle Patterns
- Candlestick Charting Explained
- Intermarket Technical Analysis
- John Murphy on Chart Analysis
- John Murphy's Chart Pattern Recognition
- John Murphy's Market Message
- MurphyExplainsMarketAnalysis-Intermarket Analysis
- MurphyExplainsMarketAnalysis-Visual Analysis
- StockCharts.com
- Technical Analysis of the Financial Markets
- The Visual Investor
- VectorVest, Inc.
- Executive Premier Workshop
- One-Day Options Course
- OptionsPro
- Retirement Income Workshop
- Sure-Fire Trading Systems (VectorVest, Inc.)
- Trading as a Business Workshop
- VectorVest 7 EOD
- VectorVest 7 RealTime/IntraDay
- VectorVest AutoTester
- VectorVest Educational Services
- VectorVest OnLine
- VectorVest Options Analyzer
- VectorVest ProGraphics v6.0
- VectorVest ProTrader 7
- VectorVest RealTime Derby Tool
- VectorVest Simulator
- VectorVest Variator
- VectorVest Watchdog
