HOT TOPICS LIST
- MACD
- Fibonacci
- RSI
- Gann
- ADXR
- Stochastics
- Volume
- Triangles
- Futures
- Cycles
- Volatility
- ZIGZAG
- MESA
- Retracement
- Aroon
INDICATORS LIST
LIST OF TOPICS
PRINT THIS ARTICLE
by Mike Carr, CMT
After soaring about 18% in less than three months, the S&P 500 reached a relative price extreme. A pullback is expected.
Position: N/A
Mike Carr, CMT
Mike Carr, CMT, is a member of the Market Technicians Association, and editor of the MTA's newsletter, Technically Speaking. He is also the author of "Smarter Investing in Any Economy: The Definitive Guide to Relative Strength Investing," and "Conquering the Divide: How to Use Economic Indicators to Catch Stock Market Trends."
PRINT THIS ARTICLE
BOLLINGER BANDS
S&P 500 Is Overbought
11/17/10 08:41:57 AMby Mike Carr, CMT
After soaring about 18% in less than three months, the S&P 500 reached a relative price extreme. A pullback is expected.
Position: N/A
| No market goes straight up forever, as economist John Maynard Keynes pointed out when he said that trees don't grow to the sky. With the leaves dropping in the autumn, we can see that trees tend to grow taller, and then take some time to grow out more branches and create a solid base for future growth. The stock market is no different; we often see consolidation phases interrupt even the most extended uptrends. |
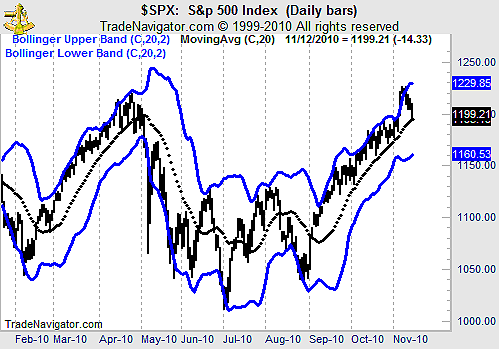
| One problem investors face is being able to spot when prices have gone too far, too fast. Bollinger bands can be used to track the relative level of prices, as shown in Figure 1. This indicator uses a moving average of the closing price as the center line. The upper line is drawn by adding two standard deviations of the changes in price to the moving average, while the lower line is the value of the moving average minus two standard deviations. |

|
| FIGURE 1: S&P 500, DAILY. Closes above the upper band often signal a short-term reversal. |
| Graphic provided by: FutureSource.com. |
| Graphic provided by: Trade Navigator. |
| |
| When prices close above the upper Bollinger band, they can be thought of as too high. Backtesting shows that shorting the market on the open the day after this occurs would have led to a winning trade about 70% of the time. Of course, the future will not be like the past and this type of winning percentage is unlikely to be repeated going forward. The trade would be closed when the price came back down to the moving average, which is shown as the center line in Figure 1. On average, trades have lasted about five days. |
| Prices pierced the upper Bollinger band on November 4. A pullback followed, as expected. For those thinking this article is merely the work of Captain Hindsight, remember that this signal has historically worked well a large percentage of the time. It could be useful to track this as a means of spotting short-term trading opportunities. |
Mike Carr, CMT, is a member of the Market Technicians Association, and editor of the MTA's newsletter, Technically Speaking. He is also the author of "Smarter Investing in Any Economy: The Definitive Guide to Relative Strength Investing," and "Conquering the Divide: How to Use Economic Indicators to Catch Stock Market Trends."
| Website: | www.moneynews.com/blogs/MichaelCarr/id-73 |
| E-mail address: | marketstrategist@gmail.com |
Click here for more information about our publications!
Comments
Date: 11/23/10Rank: 4Comment:

Request Information From Our Sponsors
- StockCharts.com, Inc.
- Candle Patterns
- Candlestick Charting Explained
- Intermarket Technical Analysis
- John Murphy on Chart Analysis
- John Murphy's Chart Pattern Recognition
- John Murphy's Market Message
- MurphyExplainsMarketAnalysis-Intermarket Analysis
- MurphyExplainsMarketAnalysis-Visual Analysis
- StockCharts.com
- Technical Analysis of the Financial Markets
- The Visual Investor
- VectorVest, Inc.
- Executive Premier Workshop
- One-Day Options Course
- OptionsPro
- Retirement Income Workshop
- Sure-Fire Trading Systems (VectorVest, Inc.)
- Trading as a Business Workshop
- VectorVest 7 EOD
- VectorVest 7 RealTime/IntraDay
- VectorVest AutoTester
- VectorVest Educational Services
- VectorVest OnLine
- VectorVest Options Analyzer
- VectorVest ProGraphics v6.0
- VectorVest ProTrader 7
- VectorVest RealTime Derby Tool
- VectorVest Simulator
- VectorVest Variator
- VectorVest Watchdog
