HOT TOPICS LIST
- MACD
- Fibonacci
- RSI
- Gann
- ADXR
- Stochastics
- Volume
- Triangles
- Futures
- Cycles
- Volatility
- ZIGZAG
- MESA
- Retracement
- Aroon
INDICATORS LIST
LIST OF TOPICS
PRINT THIS ARTICLE
by Austin Passamonte
eBAY's stock is nearing the end of its long-term wedge formation.
Position: N/A
Austin Passamonte
Austin is a private trader who trades emini stock index futures intraday. He currently trades various futures markets from home in addition to managing a trader's educational forum
PRINT THIS ARTICLE
WEDGE FORMATIONS
Bidding For eBAY
01/28/02 01:00:21 PMby Austin Passamonte
eBAY's stock is nearing the end of its long-term wedge formation.
Position: N/A
| One of the most popular pastimes on the web these days is shopping for obscure goodies and common items in eBAY. I'm a semi-frequent visitor myself and once inside spend a bit too long lingering over things I could really live without. |
| That being said, I don't anticipate leaving eBAY anytime soon and only expect the number of visitors to climb. Fundamental experts might wax poetic about forecasted earnings, P/E ratios and future market share but that's all beyond my care. I simply want to know one thing: Is the stock itself strong or weak right now? Is the stock in supply or demand? Are buyers or sellers in charge? The state of eBAY company has little to do with state of eBAY [EBAY] stock, as is always the case for all equity symbols. |

|
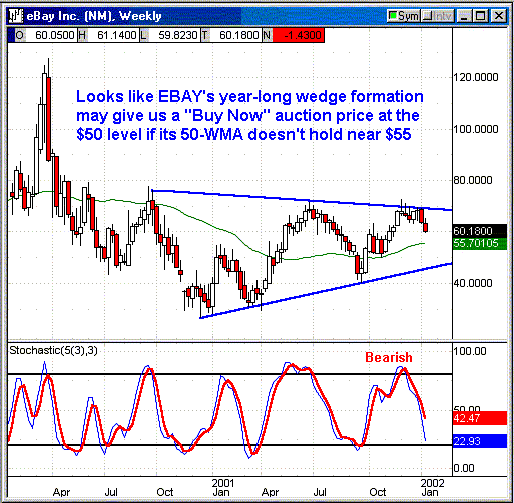
| Figure 1: Weekly Chart: EBAY |
| Graphic provided by: Quote.com. |
| Graphic provided by: QCharts. |
| |
| Since autumn 2000 we've watched EBAY channel itself into a continual wedge. No sign of that pattern breaking for now, either. Rejected at resistance near $70, price action next seeks support down around its $55+ area from here. Should that measure fail to hold, one more touch on the lower wedge line of support near the high $40s would be next. Stochastic values in mid-decline via bearish fashion suggest odds are great one or both price objectives will be met. |
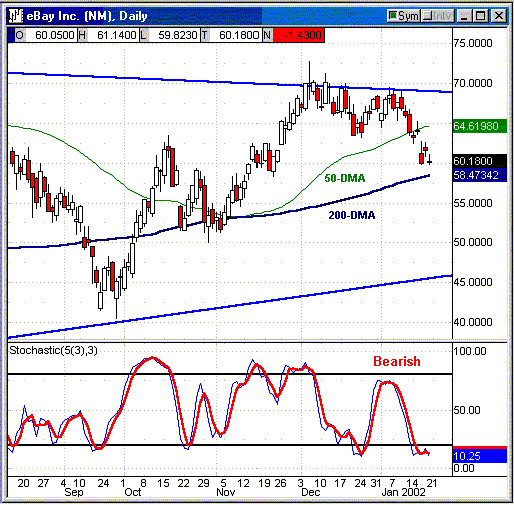
 Figure 2: Daily Chart: EBAY The exact-same chart dialed down to daily duration gives us a closer view. Stochastic values are in oversold extreme zone but show zero signs of reversing back up in bullish fashion. If the moving averages fail to hold their inevitable tests, one might expect $46 to be the next strong arm waiting to catch falling prices. Strong Company, Weak Stock? Happens all the time. Stock prices and corporate performance do not move hand-in-hand, or market efficiency would preclude any of us ever making one thin dime. No matter how many trading books you and I win the bids on inside, it has zero effect on stock prices tomorrow or next week. Trust the charts to give us points of reference on our trip toward financial wealth, and bid on their turning points found within! |
Austin is a private trader who trades emini stock index futures intraday. He currently trades various futures markets from home in addition to managing a trader's educational forum
| Title: | Individual Trader |
| Company: | CoiledMarkets.com |
| Address: | PO Box 633 |
| Naples, NY 14512 | |
| Website: | coiledmarkets.com/blog |
| E-mail address: | austinp44@yahoo.com |
Traders' Resource Links | |
| CoiledMarkets.com has not added any product or service information to TRADERS' RESOURCE. | |
Click here for more information about our publications!
Comments
Date: 01/29/02Rank: 3Comment:
Date: 01/29/02Rank: 5Comment:
Date: 01/30/02Rank: 5Comment:

Request Information From Our Sponsors
- StockCharts.com, Inc.
- Candle Patterns
- Candlestick Charting Explained
- Intermarket Technical Analysis
- John Murphy on Chart Analysis
- John Murphy's Chart Pattern Recognition
- John Murphy's Market Message
- MurphyExplainsMarketAnalysis-Intermarket Analysis
- MurphyExplainsMarketAnalysis-Visual Analysis
- StockCharts.com
- Technical Analysis of the Financial Markets
- The Visual Investor
- VectorVest, Inc.
- Executive Premier Workshop
- One-Day Options Course
- OptionsPro
- Retirement Income Workshop
- Sure-Fire Trading Systems (VectorVest, Inc.)
- Trading as a Business Workshop
- VectorVest 7 EOD
- VectorVest 7 RealTime/IntraDay
- VectorVest AutoTester
- VectorVest Educational Services
- VectorVest OnLine
- VectorVest Options Analyzer
- VectorVest ProGraphics v6.0
- VectorVest ProTrader 7
- VectorVest RealTime Derby Tool
- VectorVest Simulator
- VectorVest Variator
- VectorVest Watchdog
