HOT TOPICS LIST
- MACD
- Fibonacci
- RSI
- Gann
- ADXR
- Stochastics
- Volume
- Triangles
- Futures
- Cycles
- Volatility
- ZIGZAG
- MESA
- Retracement
- Aroon
INDICATORS LIST
LIST OF TOPICS
PRINT THIS ARTICLE
by Koos van der Merwe
So we know that the Dow Jones Industrial Average is in a wave 4 correction of a Wave III. What should our strategy be?
Position: Hold
Koos van der Merwe
Has been a technical analyst since 1969, and has worked as a futures and options trader with First Financial Futures in Johannesburg, South Africa.
PRINT THIS ARTICLE
ELLIOTT WAVE
What Now, Dow? Looking For Our Strategy
11/15/10 08:39:00 AMby Koos van der Merwe
So we know that the Dow Jones Industrial Average is in a wave 4 correction of a Wave III. What should our strategy be?
Position: Hold
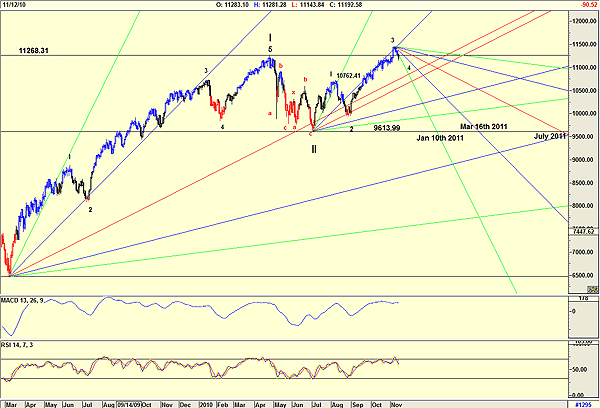
| A look at Figure 1, a daily chart of the Dow Jones Industrial Average (DJIA), suggests that the DJIA is tracing a wave 4 of Wave III. Wave 4 has two alternatives. It can be a simple wave, by which I mean straight down, or it can be a complicated abc or abcxabc count that will carry on until January 10, 2011, the date shown on the chart where the Gann fan crosses the horizontal drawn from the low of Wave II. Both the relative strength index (RSI) and the moving average convergence/divergence (MACD) indicator suggest that this correction could be long and frustrating, so in spite of what I would like to see, it does appear that the DJIA could be in for a painful month and a half. |

|
| FIGURE 1: DJIA, DAILY |
| Graphic provided by: AdvancedGET. |
| |
| But why? As a technical analyst, it is not for me to ask. I follow what the charts say, but off the top of my hat, I can only say "tax-loss selling," and frustration where a Republican Congress that caused the original meltdown under the George W. Bush administration plays stubborn and opposes anything President Obama suggests. Either way, whatever Obama does suggest is going to lead to long Congressional debates, no matter how good or bad the President's proposal may be. Fortunately, after wave 4 does come a wave 5, so we will definitely see a wave 5 recovery to complete Wave III. The problem here of course is what to do to protect our investments in the interim and of course how long will wave 4 last. Figure 1 does show that wave 4 cannot be lower than 10762.41. If it is, then may the Good Lord help us all and keep the stones away from those who voted Republican. I don't believe it will (being a Canadian, I am impartial ... I hope), because the last thing the Republicans now want is a mess of the economy. So ... how do you play this market? Well, one thing we do know is Wave 5s can be exciting and offer great opportunities to grow profits rapidly. After Wave 5 of Wave III, we can expect Wave IV, which should definitely be a simple wave, because Wave II looks very complicated. Look to July 2011. March 16 could also be the date for the Wave 5 high, as shown by the Gann fan, although I am inclined to look further out. Either way, I shall watch all the dates carefully. So ... our strategy? Use the present correction as a buying opportunity, then as wave 5 starts, start selling into strength. Then sit on the sidelines during Wave IV, mainly in cash, or in high dividend/interest payers. Toward the end of Wave IV, one should start buying again. Do keep in mind that Wave III must be greater than Wave I. With the length of Wave I = 4768.31 units (11268.31 - 6500 = 4768.31), Wave III must equal 14382.3 (9613.99+4768.31=14382.3). Should this not happen -- that is, should Wave III be less than Wave I, then Wave V will be less than Wave III, and President Obama will lead the country in a second term, with the Republicans red-faced, taking all the blame for the mess. Interesting times ahead. In the meantime, watch my articles for any deviation from this strategy. |
Has been a technical analyst since 1969, and has worked as a futures and options trader with First Financial Futures in Johannesburg, South Africa.
| Address: | 3256 West 24th Ave |
| Vancouver, BC | |
| Phone # for sales: | 6042634214 |
| E-mail address: | petroosp@gmail.com |
Click here for more information about our publications!
PRINT THIS ARTICLE

|

Request Information From Our Sponsors
- VectorVest, Inc.
- Executive Premier Workshop
- One-Day Options Course
- OptionsPro
- Retirement Income Workshop
- Sure-Fire Trading Systems (VectorVest, Inc.)
- Trading as a Business Workshop
- VectorVest 7 EOD
- VectorVest 7 RealTime/IntraDay
- VectorVest AutoTester
- VectorVest Educational Services
- VectorVest OnLine
- VectorVest Options Analyzer
- VectorVest ProGraphics v6.0
- VectorVest ProTrader 7
- VectorVest RealTime Derby Tool
- VectorVest Simulator
- VectorVest Variator
- VectorVest Watchdog
- StockCharts.com, Inc.
- Candle Patterns
- Candlestick Charting Explained
- Intermarket Technical Analysis
- John Murphy on Chart Analysis
- John Murphy's Chart Pattern Recognition
- John Murphy's Market Message
- MurphyExplainsMarketAnalysis-Intermarket Analysis
- MurphyExplainsMarketAnalysis-Visual Analysis
- StockCharts.com
- Technical Analysis of the Financial Markets
- The Visual Investor
