

HOT TOPICS LIST
- MACD
- Fibonacci
- RSI
- Gann
- ADXR
- Stochastics
- Volume
- Triangles
- Futures
- Cycles
- Volatility
- ZIGZAG
- MESA
- Retracement
- Aroon
INDICATORS LIST
LIST OF TOPICS
PRINT THIS ARTICLE
by Donald W. Pendergast, Jr.
This may not be 'the' top in the gold market, but the balance of the technical evidence still suggests that traders should be prepared for the possibility of more downside.
Position: N/A
Donald W. Pendergast, Jr.
Donald W. Pendergast is a financial markets consultant who offers specialized services to stock brokers and high net worth individuals who seek a better bottom line for their portfolios.
PRINT THIS ARTICLE
ACCUM./DIST. CHAIKIN
Mini Gold: Setup for a Major Fall?
11/10/10 07:34:54 PMby Donald W. Pendergast, Jr.
This may not be 'the' top in the gold market, but the balance of the technical evidence still suggests that traders should be prepared for the possibility of more downside.
Position: N/A
| For gold bugs, the recent daily close above $1,400 per ounce was a real cause for celebration; in fact, some metal heads began making predictions of gold at more than $5,000 (again) as this recent rally took hold. For all we know, gold may indeed hit prices once thought impossible, but right here and now we still need to keep our feet on the ground and our eyes on the charts. Here's a look at some of the key support levels and chart patterns that have materialized on the mini gold futures contract; they tell a very important story that short-term gold traders may be able to put to good use. |
|
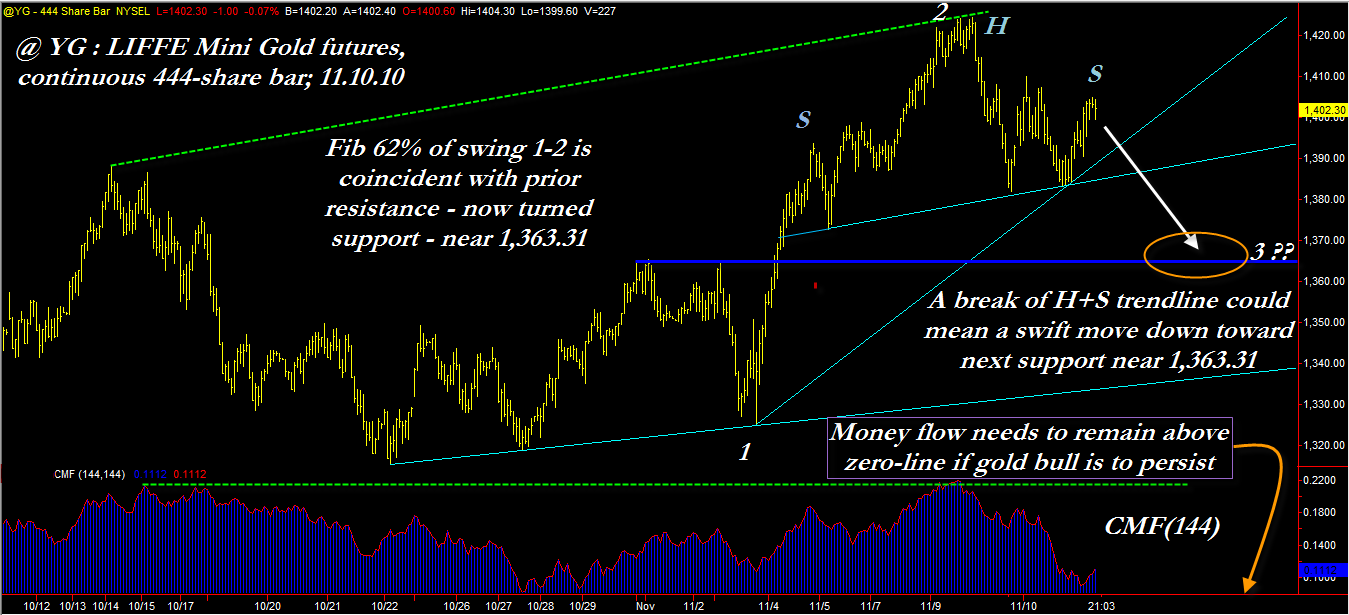
| A bearish money flow divergence finally played out; now many traders will want to monitor this very interesting head and shoulders pattern in LIFFE mini gold futures. This chart uses the 'regular' electronic trading session hours and is uses a 444-share volume bar. Also of note: the long-term money flow is still above the zero-line; a drop below it along with a H+S pattern breakdown may mean further corrective action lies ahead. |
| Graphic provided by: TradeStation. |
| |
| This is a 444-share (volume) bar chart for the LIFFE mini gold futures, continuous contract basis; there are several technical dynamics at work here, so here we go: 1. Money flow (based on a Chaikin Money flow (CMF)(144)) has plunged in the wake of Tuesday's record high gold prices, but is still above the all-important zero-line. See the lower portion of the chart for details and comments. Money flow had also failed to rally substantially on the last upthrust - it inched marginally higher than it was at the last major swing high made on October 13 2010 (see the dashed green lines on chart which depict the bearish CMF divergence). This was a tip-off that gold may have been preparing for a correction or even a major trend reversal. 2. A head and shoulders pattern has also printed; depending on how the right shoulder finally forms, this should be a very easy pattern to play on a breakdown of the up sloping aqua trend line. You can bet that plenty of other traders already have this pattern in the cross hairs, so be nimble if you decide to jump on this one (on a confirmed breakdown), as the potential for sustained follow-through looks to be very good for those with a short-selling bent. 3. Major support comes from two separate technicals - the first comes from the previous swing highs made in late October thru early November (the two swing highs prior to swing low 1) that will now provide potential support on a move lower. The second is the venerable Fibonacci 61.8% retracement of swing 1-2 (labeled on the chart), which very nearly coincides with the price level of the aforementioned swing highs; they all converge right near 1,363.31 and are depicted by the horizontal blue line on the chart. This support near 1,363 also arrives prior to the nominal price target for the H+S pattern, which comes in at around 1,350.00, making it an excellent place to consider taking some if not all of the profits on a successful H+S breakdown short entry trade. You might consider setting up a short trade as follows: 1. Wait for the H+S trend line to be violated on a closing bar basis (I am using a 444-share bar here, but you may still get a similar pattern with a 500 or 400-share bar) and then place a 'sell stop' order a tick below the low of the setup bar that breaks below the trend line. 2. Once the short order is filled, consider placing a 'buy to cover' stop loss order one tick above the price of the other up trend line (which has a much greater angle of attack) that is rooted at swing low 1. Depending on where the anticipated H+S trend line break actually occurs, the stop loss may need to be placed somewhere between 1,394.00 to 1,398.00. Assuming a short entry near 1,387.00, an initial stop at 1,396.00 and a price target of 1,364.00, the risk-reward ratio for this trade setup comes in at about 2.55 to 1, which is outstanding for such a short-term trading time frame. |
| Lately, I've read many good article concerning the gold market; one top gold market analyst suggests that $675.00 is one possible price target once the current bull market eventually disintegrates. Others, however, make a very plausible case for gold making $1,500.00 by year-end. You pay your money and you make your choice when it comes to 'theoretical' gold prices. It can be great fun to predict what a stock or futures contract will be trading at by a certain date, but when it comes to putting food on the table as the result of a consistently profitable trading method, you'd better put the 'predictions' aside and focus solely on your charts and technical trading systems and methods. They don't make predictions, but if they're based on sound trading logic and fully tested, they'll probably make you a lot more money than any market pundit's 'sure thing' market predictions will. This H+S pattern in the mini gold futures market could be one of the better short setups around, and will almost certainly attract the attention of traders who know just how powerful a well-executed pattern trade setup can be. Plot this gold futures contract (@YG or YGZ10 for those who actually wish to trade it with real $$$) on your own charting software and monitor it yourself - it will be a terrific way for you to investigate the world of chart pattern trading. |
Donald W. Pendergast is a financial markets consultant who offers specialized services to stock brokers and high net worth individuals who seek a better bottom line for their portfolios.
| Title: | Writer, market consultant |
| Company: | Linear Trading Systems LLC |
| Jacksonville, FL 32217 | |
| Phone # for sales: | 904-239-9564 |
| E-mail address: | lineartradingsys@gmail.com |
Traders' Resource Links | |
| Linear Trading Systems LLC has not added any product or service information to TRADERS' RESOURCE. | |
Click here for more information about our publications!
Comments
Date:�11/16/10Rank:�5Comment:�

Request Information From Our Sponsors
- StockCharts.com, Inc.
- Candle Patterns
- Candlestick Charting Explained
- Intermarket Technical Analysis
- John Murphy on Chart Analysis
- John Murphy's Chart Pattern Recognition
- John Murphy's Market Message
- MurphyExplainsMarketAnalysis-Intermarket Analysis
- MurphyExplainsMarketAnalysis-Visual Analysis
- StockCharts.com
- Technical Analysis of the Financial Markets
- The Visual Investor
- VectorVest, Inc.
- Executive Premier Workshop
- One-Day Options Course
- OptionsPro
- Retirement Income Workshop
- Sure-Fire Trading Systems (VectorVest, Inc.)
- Trading as a Business Workshop
- VectorVest 7 EOD
- VectorVest 7 RealTime/IntraDay
- VectorVest AutoTester
- VectorVest Educational Services
- VectorVest OnLine
- VectorVest Options Analyzer
- VectorVest ProGraphics v6.0
- VectorVest ProTrader 7
- VectorVest RealTime Derby Tool
- VectorVest Simulator
- VectorVest Variator
- VectorVest Watchdog