HOT TOPICS LIST
- MACD
- Fibonacci
- RSI
- Gann
- ADXR
- Stochastics
- Volume
- Triangles
- Futures
- Cycles
- Volatility
- ZIGZAG
- MESA
- Retracement
- Aroon
INDICATORS LIST
LIST OF TOPICS
PRINT THIS ARTICLE
by Koos van der Merwe
Canada fared far better than the US did in the recent meltdown. If you want to buy Canada, here is a share you may want to consider.
Position: Buy
Koos van der Merwe
Has been a technical analyst since 1969, and has worked as a futures and options trader with First Financial Futures in Johannesburg, South Africa.
PRINT THIS ARTICLE
POINT & FIGURE
SNC-Lavalin Group
11/08/10 09:36:37 AMby Koos van der Merwe
Canada fared far better than the US did in the recent meltdown. If you want to buy Canada, here is a share you may want to consider.
Position: Buy
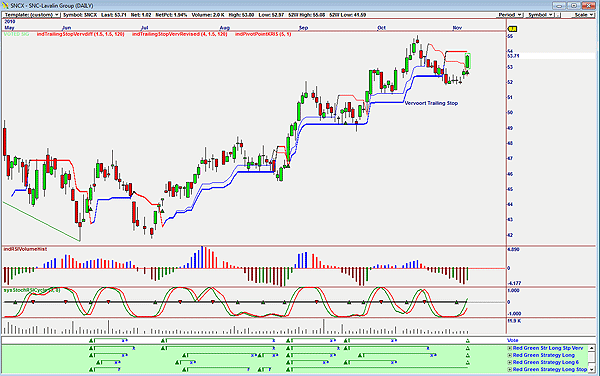
| SNC-Lavalin is one of the world's leading engineering organizations. Figure 1 is an OmniTrader chart showing that the vote line has given a buy signal with the recent rise in the share price. As you can see, every time the vote line has given a buy signal, the share price has moved up considerably. We can also see on the chart that the relative strength index (RSI) volume histogram indicator has given a buy signal, as has the stochastic RSI cycle indicator. |

|
| FIGURE 1: SNCX, DAILY. Here's the red/green buy signal. |
| Graphic provided by: OmniTrader. |
| |
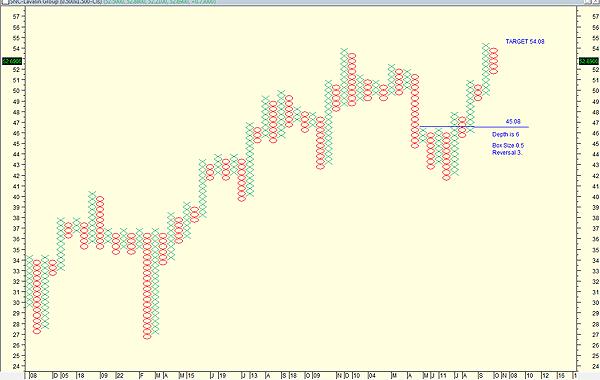
| To determine a target, I reverted to a point & figure chart, and a horizontal count (Figure 2). The count gave me a target of $54.08 (that is, the box size is 0.5; reversal is 3; depth is 6. Calculation is 0.5 x 3 = 1.5 x 6 = 9 + 45.08 = 54.08). As you can see from the charts, the price reached this target but has since fallen back. SNC Lavalin is a buy, as given by my OmniTrader strategy. It may be a short-term buy, rising to retest the 54.08 target shown on the point & figure chart, or it may break above that level and go even higher, following the previous P&F pattern. It's definitely a share to consider at present levels. |

|
| FIGURE 2: SNCX. This point & figure chart shows the target. |
| Graphic provided by: MetaStock. |
| |
Has been a technical analyst since 1969, and has worked as a futures and options trader with First Financial Futures in Johannesburg, South Africa.
| Address: | 3256 West 24th Ave |
| Vancouver, BC | |
| Phone # for sales: | 6042634214 |
| E-mail address: | petroosp@gmail.com |
Click here for more information about our publications!
Comments
Date: 11/13/10Rank: 5Comment: Hello from France,
I also use Omnitrader, is it possible to have details about your RED/GREEN Strategy ?
Thank you,
Best regards,
Alphonse Martinod
amartinod@free.fr

Request Information From Our Sponsors
- StockCharts.com, Inc.
- Candle Patterns
- Candlestick Charting Explained
- Intermarket Technical Analysis
- John Murphy on Chart Analysis
- John Murphy's Chart Pattern Recognition
- John Murphy's Market Message
- MurphyExplainsMarketAnalysis-Intermarket Analysis
- MurphyExplainsMarketAnalysis-Visual Analysis
- StockCharts.com
- Technical Analysis of the Financial Markets
- The Visual Investor
- VectorVest, Inc.
- Executive Premier Workshop
- One-Day Options Course
- OptionsPro
- Retirement Income Workshop
- Sure-Fire Trading Systems (VectorVest, Inc.)
- Trading as a Business Workshop
- VectorVest 7 EOD
- VectorVest 7 RealTime/IntraDay
- VectorVest AutoTester
- VectorVest Educational Services
- VectorVest OnLine
- VectorVest Options Analyzer
- VectorVest ProGraphics v6.0
- VectorVest ProTrader 7
- VectorVest RealTime Derby Tool
- VectorVest Simulator
- VectorVest Variator
- VectorVest Watchdog
