HOT TOPICS LIST
- MACD
- Fibonacci
- RSI
- Gann
- ADXR
- Stochastics
- Volume
- Triangles
- Futures
- Cycles
- Volatility
- ZIGZAG
- MESA
- Retracement
- Aroon
INDICATORS LIST
LIST OF TOPICS
PRINT THIS ARTICLE
by Chaitali Mohile
The Dow Jones Industrial Average is likely to climb steadily and with robust support.
Position: Hold
Chaitali Mohile
Active trader in the Indian stock markets since 2003 and a full-time writer. Trading is largely based upon technical analysis.
PRINT THIS ARTICLE
TECHNICAL ANALYSIS
DJIA Undergoing Steady Rally
11/08/10 01:36:26 PMby Chaitali Mohile
The Dow Jones Industrial Average is likely to climb steadily and with robust support.
Position: Hold
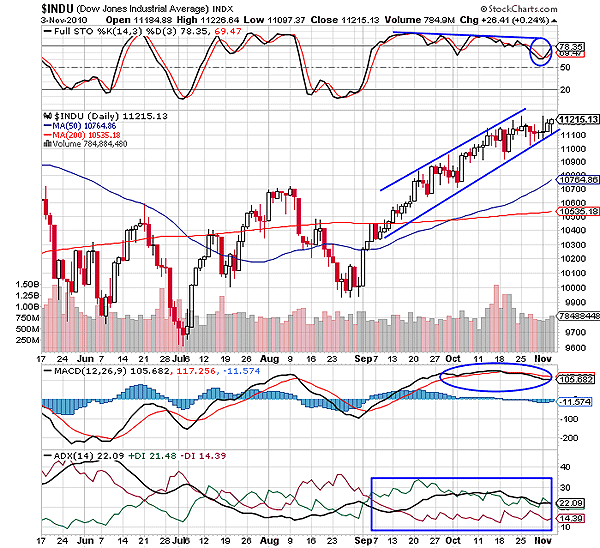
| After a bullish 200-day moving average (MA) breakout, the Dow Jones Industrial Average (DJIA) began a fresh upward journey on positive notes and with bullish sentiments. The index gradually moved upward, forming an ascending triangle and not a rising wedge. Since the volume is very stable (and at times even surged) and the trading range is not converging, the pattern is considered to be an ascending channel. The index has been moving between the two trendlines without much hassle. Both trendlines were challenged by the upper and lower shadows of the bearish candlesticks (red) more frequently. In other words, the shadows developed resistance and support for themselves during the current bullish rally. The DJIA has moved from 10,500 to 11,210. However, the small doji with long shadows saturated at the top near 11,100 and 11,200 levels, suggest the possibility of a slowdown in the rally. |

|
| FIGURE 1: DJIA, DAILY |
| Graphic provided by: StockCharts.com. |
| |
| The full stochastic (14,3,3) has been highly overbought for about two months and has marginally descended, forming lower highs. Therefore, a negative divergence in Figure 1 suggests diminishing momentum that would decelerate the speed of the rally. Although the oscillator plunged below 70 levels, it has established support in the bullish region, and therefore the price rally would definitely continue its bullish journey. In addition, the average directional index (ADX) (14) is signifying a steady uptrend in Figure 1. Thus, the rally is not at risk but would be surrendered by the volatility at the current higher level. The negative moving average convergence/divergence (MACD) (12,26,9) in positive territory reflects the incoming volatility clouds in the coming rally. |

|
| FIGURE 2: DJIA, WEEKLY |
| Graphic provided by: StockCharts.com. |
| |
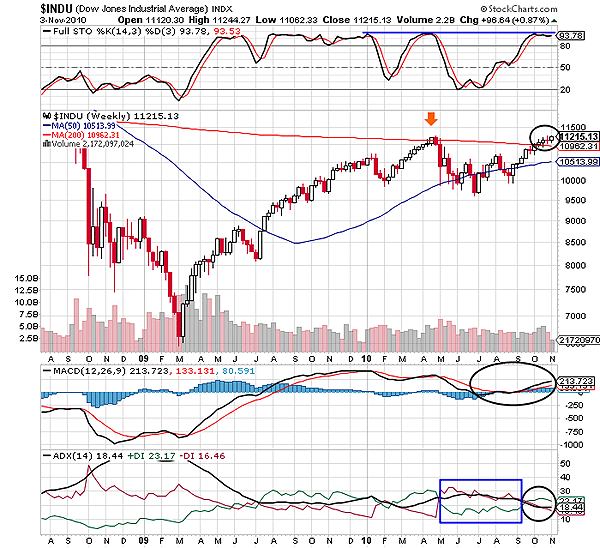
| The index has breached the 200-day MA resistance in Figure 2. Earlier, the DJIA had corrected by hitting the MA resistance, losing nearly 500 points. But the pullback rally with the support of the 50-day moving average (MA) has recently converted the long-term MA resistance (200-day) to support. Due to the breakout, an intermediate downtrend shown by the ADX (14) in Figure 2 has weakened. Although the buying pressure has improved, the uptrend has not developed as the ADX line is below 20 levels. The stochastic oscillator has surged again in the overbought region and is likely to move flat here, which would curtail the recovery speed of DJIA. The MACD (12,26,9) in Figure 2 has managed to establish support at the zero line and sustain in a positive region. Therefore, the indicators are suggesting slow price action by the index. |
| The shrinking size of the bullish candles in Figure 2 also reflects that the price rally is tired and is likely to calm down. The 200-day MA is the robust support of DJIA, which would protect the bullish rally if any selling pressure comes in unexpectedly. |
| Apart from the volatility, the DJIA is likely to undergo a steady bullish rally in near future. |
Active trader in the Indian stock markets since 2003 and a full-time writer. Trading is largely based upon technical analysis.
| Company: | Independent |
| Address: | C1/3 Parth Indraprasth Towers. Vastrapur |
| Ahmedabad, Guj 380015 | |
| E-mail address: | chaitalimohile@yahoo.co.in |
Traders' Resource Links | |
| Independent has not added any product or service information to TRADERS' RESOURCE. | |
Click here for more information about our publications!
PRINT THIS ARTICLE

Request Information From Our Sponsors
- StockCharts.com, Inc.
- Candle Patterns
- Candlestick Charting Explained
- Intermarket Technical Analysis
- John Murphy on Chart Analysis
- John Murphy's Chart Pattern Recognition
- John Murphy's Market Message
- MurphyExplainsMarketAnalysis-Intermarket Analysis
- MurphyExplainsMarketAnalysis-Visual Analysis
- StockCharts.com
- Technical Analysis of the Financial Markets
- The Visual Investor
- VectorVest, Inc.
- Executive Premier Workshop
- One-Day Options Course
- OptionsPro
- Retirement Income Workshop
- Sure-Fire Trading Systems (VectorVest, Inc.)
- Trading as a Business Workshop
- VectorVest 7 EOD
- VectorVest 7 RealTime/IntraDay
- VectorVest AutoTester
- VectorVest Educational Services
- VectorVest OnLine
- VectorVest Options Analyzer
- VectorVest ProGraphics v6.0
- VectorVest ProTrader 7
- VectorVest RealTime Derby Tool
- VectorVest Simulator
- VectorVest Variator
- VectorVest Watchdog
