HOT TOPICS LIST
- MACD
- Fibonacci
- RSI
- Gann
- ADXR
- Stochastics
- Volume
- Triangles
- Futures
- Cycles
- Volatility
- ZIGZAG
- MESA
- Retracement
- Aroon
INDICATORS LIST
LIST OF TOPICS
PRINT THIS ARTICLE
by Austin Passamonte
IBM stock has amassed some sizeable gains since late September 2001. What's in store for "Big Blue"?
Position: N/A
Austin Passamonte
Austin is a private trader who trades emini stock index futures intraday. He currently trades various futures markets from home in addition to managing a trader's educational forum
PRINT THIS ARTICLE
TECHNICAL ANALYSIS
Bellwether Tech?
01/29/02 01:03:34 PMby Austin Passamonte
IBM stock has amassed some sizeable gains since late September 2001. What's in store for "Big Blue"?
Position: N/A
| During the last bear market rally from late September to early December, few big cap stocks performed more strongly than IBM. Market pundits are now saying it is THE standard of measure in technology. If indeed that's the case, it would behoove those who focus on trading technology to see where the market is going. |
| Better than that, as a component of the Dow and heavyweight in the S&P 100 and 500 indexes Big Blue is a market-moving model for sure! |

|
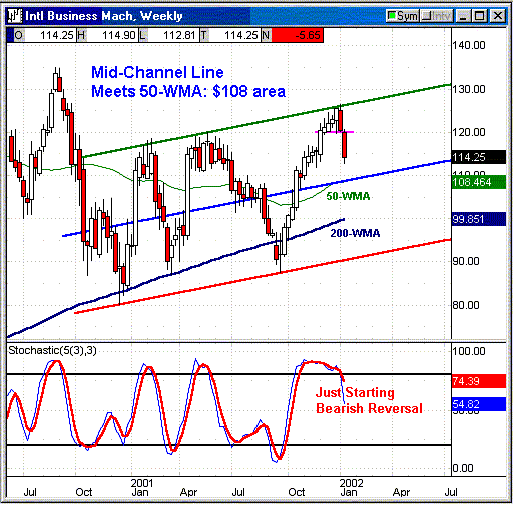
| Figure 1: Weekly Chart: IBM |
| Graphic provided by: Quote.com. |
| Graphic provided by: QCharts. |
| |
| IBM's now "coming in" for those bulls who lament missing the first ride up. I personally would not touch it on the long side until those weekly chart signals reach oversold extremes and turn bullish from there. Where might that be? My guess is the $100 range in a few weeks (or less). Stochastic values will eventually reach oversold extreme on a weekly chart basis and turn bullish reversals from there, probably to signal the next strong upside move ahead. |
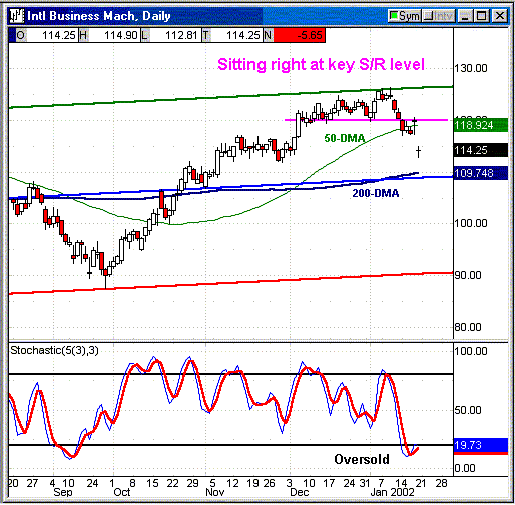
 Figure 2: Daily Chart: IBM Daily chart stochastic values have reached an oversold extreme, but we might expect them to remain pinned near there until weekly chart readings join them in unison. Right now the $109 area seems logical for an attempted bounce straight ahead. So Goes The Market? We all heard numerous media bulls pounding the table for IBM at $150 and beyond. While that price target may indeed be met to the upside eventually, technical indications suggest it will happen on a rebound from sub-$110 and possibly deeper still. Knowing what a few key bellwethers are doing is important for filtering trend direction and striving to stay on the proper side! |
Austin is a private trader who trades emini stock index futures intraday. He currently trades various futures markets from home in addition to managing a trader's educational forum
| Title: | Individual Trader |
| Company: | CoiledMarkets.com |
| Address: | PO Box 633 |
| Naples, NY 14512 | |
| Website: | coiledmarkets.com/blog |
| E-mail address: | austinp44@yahoo.com |
Traders' Resource Links | |
| CoiledMarkets.com has not added any product or service information to TRADERS' RESOURCE. | |
Click here for more information about our publications!
PRINT THIS ARTICLE

|

Request Information From Our Sponsors
- StockCharts.com, Inc.
- Candle Patterns
- Candlestick Charting Explained
- Intermarket Technical Analysis
- John Murphy on Chart Analysis
- John Murphy's Chart Pattern Recognition
- John Murphy's Market Message
- MurphyExplainsMarketAnalysis-Intermarket Analysis
- MurphyExplainsMarketAnalysis-Visual Analysis
- StockCharts.com
- Technical Analysis of the Financial Markets
- The Visual Investor
- VectorVest, Inc.
- Executive Premier Workshop
- One-Day Options Course
- OptionsPro
- Retirement Income Workshop
- Sure-Fire Trading Systems (VectorVest, Inc.)
- Trading as a Business Workshop
- VectorVest 7 EOD
- VectorVest 7 RealTime/IntraDay
- VectorVest AutoTester
- VectorVest Educational Services
- VectorVest OnLine
- VectorVest Options Analyzer
- VectorVest ProGraphics v6.0
- VectorVest ProTrader 7
- VectorVest RealTime Derby Tool
- VectorVest Simulator
- VectorVest Variator
- VectorVest Watchdog
