

HOT TOPICS LIST
- MACD
- Fibonacci
- RSI
- Gann
- ADXR
- Stochastics
- Volume
- Triangles
- Futures
- Cycles
- Volatility
- ZIGZAG
- MESA
- Retracement
- Aroon
INDICATORS LIST
LIST OF TOPICS
PRINT THIS ARTICLE
by Alan R. Northam
Linear regression can be used to determine the technical condition of the US dollar.
Position: N/A
Alan R. Northam
Alan Northam lives in the Dallas, Texas area and as an electronic engineer gave him an analytical mind from which he has developed a thorough knowledge of stock market technical analysis. His abilities to analyze the future direction of the stock market has allowed him to successfully trade of his own portfolio over the last 30 years. Mr. Northam is now retired and trading the stock market full time. You can reach him at inquiry@tradersclassroom.com or by visiting his website at http://www.tradersclassroom.com. You can also follow him on Twitter @TradersClassrm.
PRINT THIS ARTICLE
LINEAR REG CHANNEL
US Dollar ETF In Bottoming Process
11/05/10 09:28:39 AMby Alan R. Northam
Linear regression can be used to determine the technical condition of the US dollar.
Position: N/A
| Linear regression analysis is based solely upon the mathematical discipline of statistics and is a virtually nonsubjective form of technical analysis. I say "virtually nonsubjective" in that the only subjective part lies in identifying the period of the regression channel. Other forms of technical analysis are open to various methods of interpretation and, therefore, a more subjective form of technical analysis when compared to linear regression. It is not widely used because it is not a well-understood discipline within the community of traders. |
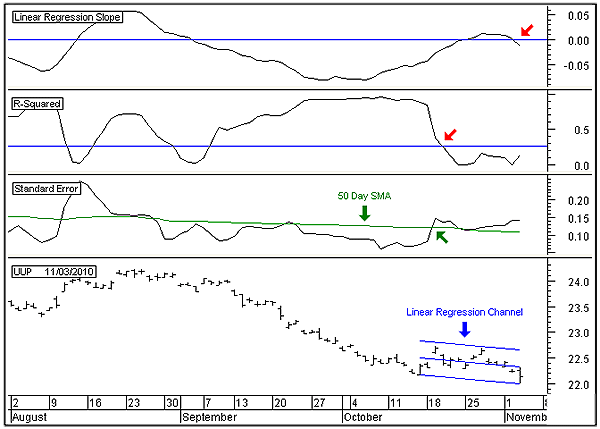
| Figure 1 shows the daily price bar chart of the PowerShares Bullish Dollar exchange traded fund (ETF) (UUP) in the lower panel. I have also plotted a 14-day linear regression channel on this price chart. I chose the 14-day period as it properly touches the linear regression channel on at least three occasions and is therefore a valid channel. The middle horizontal line of the regression channel is the main regression line and represents the trend of the price chart. The two parallel outer lines are the channel lines and represent support and resistance. The top two panels show the two indicators that are derived from the mathematical equation of the linear regression line. The top indicator represents the slope of the linear regression line or the trend, which is referred to as the "linear regression slope." The next lower panel indicator represents the strength of the linear regression line or trend, which is referred to as "R-squared." The third panel from the top is derived from the standard error equation and represents the volatility of price, which is referred to as "standard error." |
|
| FIGURE 1: UUP, DAILY. This figure shows the 14-day linear regression channel applied to the price chart. The linear regression slope, R-squared, and standard error indicators are derived from mathematical equations from the discipline of statistics. |
| Graphic provided by: MetaStock. |
| |
| Looking at the top indicator, note that it has now turned downward and crossed below its zero line. This indicates that the linear regression line is sloping downward, or that the 14-day trend in price is pointing downward. However, the R-squared indicator is below its critical level. The level is determined from a complex mathematical equation from statistics. The level determines the presence of a strong trend with a 95% probability. Since the R-squared line is below the critical level, it signals that there is no significant trend at present. This is a telltale sign that UUP is most likely in a bottoming process. |
| The standard error indicator is currently moving upward and is above its 50-day simple moving average. The standard error indicator represents the volatility of the price data over the last 14 days. In essence, it is a measure of how close the closing price of UUP is in relation to the linear regression line. Note that over the last 14 days, the price bars have been either above or below the linear regression line for seven of those 14 days. This is a measure of volatility. A low-volatility situation would have developed if all the daily price bars were riding on the linear regression line. In periods where price shows high volatility, it is an indication that the trend of price is most likely about to reverse directions. |
| In conclusion, UUP remains in an insignificant shallow downtrend. This is equivalent to a weakening trend, which normally occurs just before a reversal in direction. In addition, volatility is also starting to increase, which is a telltale sign of a bottoming process. While UUP has not yet reversed direction, all the signs are present that UUP is in a bottoming process with a reversal in direction to follow. |
Alan Northam lives in the Dallas, Texas area and as an electronic engineer gave him an analytical mind from which he has developed a thorough knowledge of stock market technical analysis. His abilities to analyze the future direction of the stock market has allowed him to successfully trade of his own portfolio over the last 30 years. Mr. Northam is now retired and trading the stock market full time. You can reach him at inquiry@tradersclassroom.com or by visiting his website at http://www.tradersclassroom.com. You can also follow him on Twitter @TradersClassrm.
| Garland, Tx | |
| Website: | www.tradersclassroom.com |
| E-mail address: | inquiry@tradersclassroom.com |
Click here for more information about our publications!
PRINT THIS ARTICLE

Request Information From Our Sponsors
- StockCharts.com, Inc.
- Candle Patterns
- Candlestick Charting Explained
- Intermarket Technical Analysis
- John Murphy on Chart Analysis
- John Murphy's Chart Pattern Recognition
- John Murphy's Market Message
- MurphyExplainsMarketAnalysis-Intermarket Analysis
- MurphyExplainsMarketAnalysis-Visual Analysis
- StockCharts.com
- Technical Analysis of the Financial Markets
- The Visual Investor
- VectorVest, Inc.
- Executive Premier Workshop
- One-Day Options Course
- OptionsPro
- Retirement Income Workshop
- Sure-Fire Trading Systems (VectorVest, Inc.)
- Trading as a Business Workshop
- VectorVest 7 EOD
- VectorVest 7 RealTime/IntraDay
- VectorVest AutoTester
- VectorVest Educational Services
- VectorVest OnLine
- VectorVest Options Analyzer
- VectorVest ProGraphics v6.0
- VectorVest ProTrader 7
- VectorVest RealTime Derby Tool
- VectorVest Simulator
- VectorVest Variator
- VectorVest Watchdog