HOT TOPICS LIST
- MACD
- Fibonacci
- RSI
- Gann
- ADXR
- Stochastics
- Volume
- Triangles
- Futures
- Cycles
- Volatility
- ZIGZAG
- MESA
- Retracement
- Aroon
INDICATORS LIST
LIST OF TOPICS
PRINT THIS ARTICLE
by Koos van der Merwe
The Republicans have taken the US House of Representatives. How does this affect the market?
Position: Hold
Koos van der Merwe
Has been a technical analyst since 1969, and has worked as a futures and options trader with First Financial Futures in Johannesburg, South Africa.
PRINT THIS ARTICLE
HEAD & SHOULDERS
The Wave 4 Correction
11/04/10 08:56:48 AMby Koos van der Merwe
The Republicans have taken the US House of Representatives. How does this affect the market?
Position: Hold
| The Republicans have taken the House of Representatives, and the Dow Jones Industrial Average (DJIA) drops as expected. Is this because of the feeling that government is now at a stalemate? I don't believe that. The market may be correcting because of the political uncertainty rather than any negative action. The charts are saying that a wave 4 down is followed by a wave 5 up, which is usually a very strong move up. Let us now look at the Standard & Poor's 500. |

|
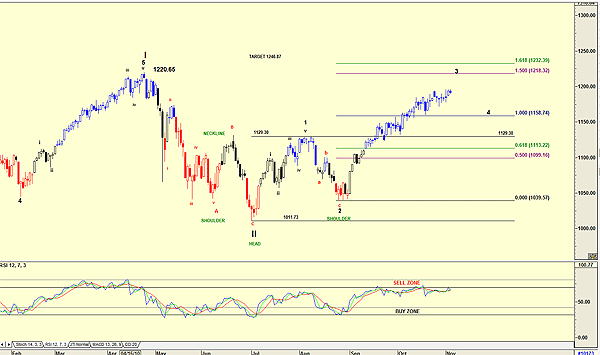
| FIGURE 1: S&P 500, DAILY |
| Graphic provided by: AdvancedGET. |
| |
| Figure 1 is a daily chart of the S&P 500 and shows the following: A. An inverted head & shoulders formation with a target of 1246.87 (1129.30 - 1011.73 = 117.57 + 1129.30 = 1246.87). This target could be the target for wave 5 of Wave III. B. The relative strength index (RSI) is flirting with the sell zone, suggesting that the wave 4 of Wave III correction should be on the cards. However, note that a definite sell signal has not been given. C. However, Fibonacci projections of wave 1 of Wave III are suggesting a 1.50 projection of 1218.32 and a 1.618 projection of 1232.39, the latter close enough to the inverted head & shoulder target to be considered. Being the proverbial optimist (I am a Canadian citizen), and feeling confident that politics in the United States does not lead the market, I believe that the S&P 500 is still very bullish, and any correction is simply another opportunity to buy. |
Has been a technical analyst since 1969, and has worked as a futures and options trader with First Financial Futures in Johannesburg, South Africa.
| Address: | 3256 West 24th Ave |
| Vancouver, BC | |
| Phone # for sales: | 6042634214 |
| E-mail address: | petroosp@gmail.com |
Click here for more information about our publications!
Comments

|

Request Information From Our Sponsors
- StockCharts.com, Inc.
- Candle Patterns
- Candlestick Charting Explained
- Intermarket Technical Analysis
- John Murphy on Chart Analysis
- John Murphy's Chart Pattern Recognition
- John Murphy's Market Message
- MurphyExplainsMarketAnalysis-Intermarket Analysis
- MurphyExplainsMarketAnalysis-Visual Analysis
- StockCharts.com
- Technical Analysis of the Financial Markets
- The Visual Investor
- VectorVest, Inc.
- Executive Premier Workshop
- One-Day Options Course
- OptionsPro
- Retirement Income Workshop
- Sure-Fire Trading Systems (VectorVest, Inc.)
- Trading as a Business Workshop
- VectorVest 7 EOD
- VectorVest 7 RealTime/IntraDay
- VectorVest AutoTester
- VectorVest Educational Services
- VectorVest OnLine
- VectorVest Options Analyzer
- VectorVest ProGraphics v6.0
- VectorVest ProTrader 7
- VectorVest RealTime Derby Tool
- VectorVest Simulator
- VectorVest Variator
- VectorVest Watchdog
