HOT TOPICS LIST
- MACD
- Fibonacci
- RSI
- Gann
- ADXR
- Stochastics
- Volume
- Triangles
- Futures
- Cycles
- Volatility
- ZIGZAG
- MESA
- Retracement
- Aroon
INDICATORS LIST
LIST OF TOPICS
PRINT THIS ARTICLE
by Chaitali Mohile
Which way will EBS break out?
Position: N/A
Chaitali Mohile
Active trader in the Indian stock markets since 2003 and a full-time writer. Trading is largely based upon technical analysis.
PRINT THIS ARTICLE
TRIANGLES
EBS Waiting For Breakout
11/02/10 12:25:59 PMby Chaitali Mohile
Which way will EBS break out?
Position: N/A
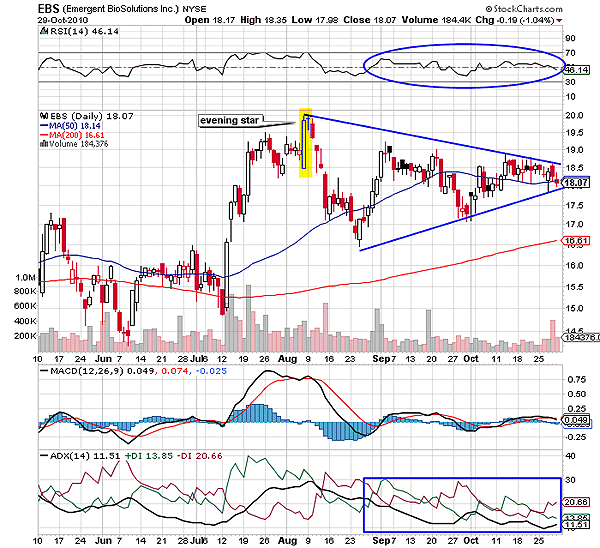
| Emergent BioSolution (EBS) lacked bullish strength to continue its rally from $15. The bearish candles (red) and the upper/lower shadows of the candles during the bullish rally showed significant weakness in the advance rally from $15 to $20 in Figure 1. The breakout journey of the relative strength index (RSI) (14) above 50 levels was restricted by 70 levels, indicating weakness in carrying the rally higher. An evening star candlestick formation on the price chart confirmed the reluctance to surge. The yellow block shows the group of three candlesticks: a bullish candles, a doji followed by a bearish candle, and an evening star formation. The first candle reflects the current uptrend, the doji suggesting an uncertainty to sustain in the uptrend while the third bearish candle highlights a new downtrend. The formation is considered to be a bearish trend reversal that initiates a fresh bearish trend. In Figure 1, we can see that the uptrend indicated by the average directional index (ADX) (14) was captured by the fresh bearish force, reversing the existing uptrend. |

|
| FIGURE 1: EBS, DAILY. The two trendlines of the symmetrical triangle have converged and the stock is ready to break out in either direction. |
| Graphic provided by: StockCharts.com. |
| |
| Afterward, EBS plunged to $16 and formed a series of lower highs and higher lows. The tricky RSI (14) and the weakening downtrend forced the stock to move within the narrowing range, forming a symmetrical triangle. Among the three triangles -- ascending, descending, and symmetrical -- the breakout direction of the symmetrical triangle is unknown. This triangle can break in any direction that is upward or downward, and there are no particular rules about the breakout directions. Due to the narrowing range, the upper and the lower trendlines converge in the symmetrical triangle. In Figure 1, EBS has formed the symmetrical triangle and the converging trendline indicate the possibility of the breakout. The trading range has narrowed, and therefore, EBS is ready for the breakout. The moving average convergence/divergence (MACD) (12,26,9) shows high volatility, adding more uncertainty in the breakout direction. The other two indicators in Figure 1 are neutral. |

|
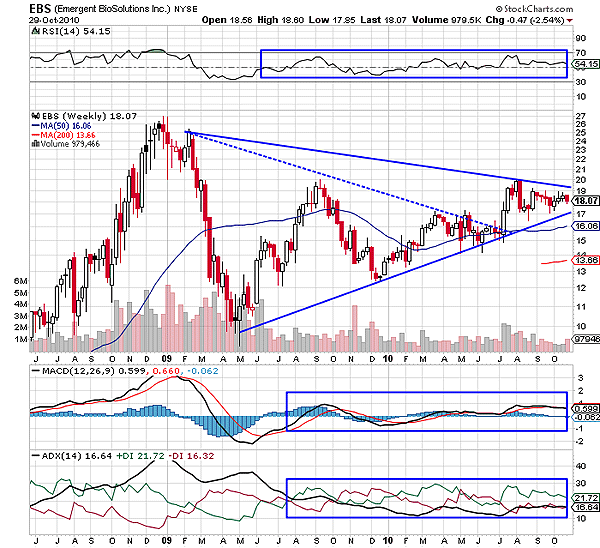
| FIGURE 2: EBS, WEEKLY. The smaller symmetrical triangle has breached the upper trendline and surged higher. |
| Graphic provided by: StockCharts.com. |
| |
| EBS has formed the symmetrical triangle on the weekly time frame in Figure 2 as well. However, the pattern in Figure 2 is long term with the time span of one year. The dotted blue upper trendline shows one more symmetrical triangle within the large triangle. The former triangle has already broken upward. The breakout rally has moved sideways in the narrow range, which helped to extend the upper trendline of the large triangle. The pattern is considered to be stronger, as the triangle has appeared on both the time frames. In Figure 2, there is also no clarity about the breakout direction. The RSI (14) ranges between 50 and 60 levels, the ADX (14) has moved in the weaker section below 15 levels, and the MACD (12,26,9) is negative. Thus, no particular direction is signaled by the indicators to guide traders and investors to anticipate the breakout. |
| Thus, EBS must be added to the watchlist for the breakout. Traders can trigger the trade according to the breakout direction. |
Active trader in the Indian stock markets since 2003 and a full-time writer. Trading is largely based upon technical analysis.
| Company: | Independent |
| Address: | C1/3 Parth Indraprasth Towers. Vastrapur |
| Ahmedabad, Guj 380015 | |
| E-mail address: | chaitalimohile@yahoo.co.in |
Traders' Resource Links | |
| Independent has not added any product or service information to TRADERS' RESOURCE. | |
Click here for more information about our publications!
PRINT THIS ARTICLE

Request Information From Our Sponsors
- VectorVest, Inc.
- Executive Premier Workshop
- One-Day Options Course
- OptionsPro
- Retirement Income Workshop
- Sure-Fire Trading Systems (VectorVest, Inc.)
- Trading as a Business Workshop
- VectorVest 7 EOD
- VectorVest 7 RealTime/IntraDay
- VectorVest AutoTester
- VectorVest Educational Services
- VectorVest OnLine
- VectorVest Options Analyzer
- VectorVest ProGraphics v6.0
- VectorVest ProTrader 7
- VectorVest RealTime Derby Tool
- VectorVest Simulator
- VectorVest Variator
- VectorVest Watchdog
- StockCharts.com, Inc.
- Candle Patterns
- Candlestick Charting Explained
- Intermarket Technical Analysis
- John Murphy on Chart Analysis
- John Murphy's Chart Pattern Recognition
- John Murphy's Market Message
- MurphyExplainsMarketAnalysis-Intermarket Analysis
- MurphyExplainsMarketAnalysis-Visual Analysis
- StockCharts.com
- Technical Analysis of the Financial Markets
- The Visual Investor
