HOT TOPICS LIST
- MACD
- Fibonacci
- RSI
- Gann
- ADXR
- Stochastics
- Volume
- Triangles
- Futures
- Cycles
- Volatility
- ZIGZAG
- MESA
- Retracement
- Aroon
INDICATORS LIST
LIST OF TOPICS
PRINT THIS ARTICLE
by Ranjan Jha, CMT
Near-term upside looks limited for oil drillers.
Position: N/A
Ranjan Jha, CMT
I am a member of the Market Technicians Association and manage a limited partnership investment club in Virginia. Always seek advice from your own Financial Advisor before acting on any method outlined here since every circumstance is different.
PRINT THIS ARTICLE
CHART ANALYSIS
Oil Drillers Hit Resistance
10/29/10 09:04:33 AMby Ranjan Jha, CMT
Near-term upside looks limited for oil drillers.
Position: N/A
| The Oil Services HOLDRs exchange traded fund (OIH) includes big drilling names like Transocean, Schlumberger, Diamond Offshore, and Halliburton. Some of these companies got directly affected by the offshore drilling ban after the BP offshore drilling disaster. After initial selloff from late April to June 2010, OIH was range-bound for most of the summer. Lately, it has staged a rally that appears to be out of steam now. |
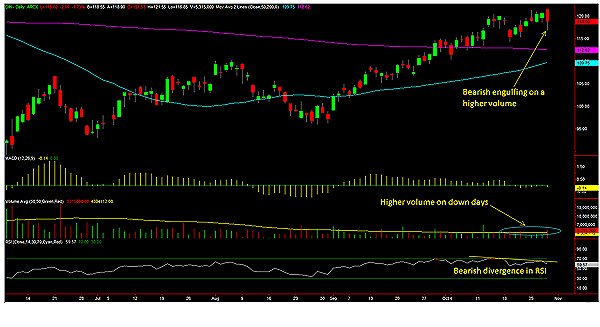
| Figure 1 shows a daily candlestick chart of OIH. It has moved almost in a straight line since the September market bottom of this year. Recently, it has traded on relatively heavier volume on down days. Both the moving average convergence/divergence (MACD) and the relative strength index (RSI) have been showing bearish divergence lately. Finally, the latest price action shows a bearish engulfing candlestick pattern on a high volume, indicating OIH can come under some distribution. |

|
| FIGURE 1: OIL SERVICES HOLDRs (OIH), DAILY. The recent runup appears to be weakening. |
| Graphic provided by: TradeStation. |
| |
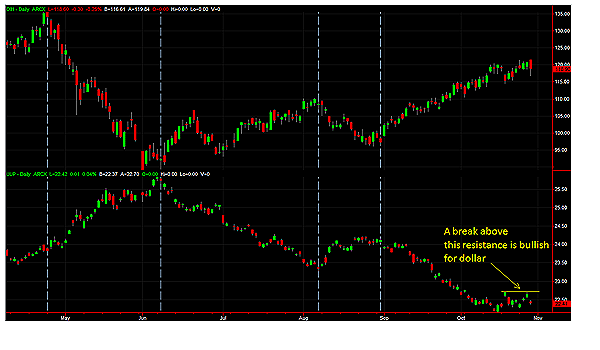
| Figure 2 shows the intermarket aspect of trading in OIH. Globally, oil is priced in US dollars so if the dollar goes down, oil goes up. Naturally, OIH trades in sync with the price of oil. The recent runup in OIH can be explained by the falling dollar. Figure 2 shows how OIH has been trending almost exactly opposite of PowerShares DB US Dollar Index Bullish (UUP), a proxy for the US dollar for the last several months. Now, the dollar appears to have broken its downtrend. A move above the resistance line shown will indicate that short positions in the dollar are being taken off, and that may not be good for OIH at least in the near term. |

|
| FIGURE 2: OIL SERVICES HOLDRs (OIH) AND POWERSHARES DB US DOLLAR INDEX BULLISH (UUP), DAILY. Invariably, they trend in the opposite direction. |
| Graphic provided by: TradeStation. |
| |
| Most of the recent down move in the dollar has been based on the expectations that the Federal Reserve might provide substantial monetary stimulus, or quantitative easing (QE). There is a very good chance that most of the QE's effect is already priced in the current value of the dollar. By the time the Fed actually begins its monetary injection in early November 2010, the dollar may start moving in the opposite direction, and then OIH may be under some selling pressure. Besides, OIH has about 20% gain since early September of this year. It may be a good idea to take some long position in OIH off the table and see how the market reacts to the Fed easing when it takes place. |
I am a member of the Market Technicians Association and manage a limited partnership investment club in Virginia. Always seek advice from your own Financial Advisor before acting on any method outlined here since every circumstance is different.
| Address: | 2039 Stone Mill Drive |
| Salem, VA 24153 | |
| Phone # for sales: | 540-330-2911 |
| E-mail address: | ranjanjha@hotmail.com |
Click here for more information about our publications!
Comments

Request Information From Our Sponsors
- StockCharts.com, Inc.
- Candle Patterns
- Candlestick Charting Explained
- Intermarket Technical Analysis
- John Murphy on Chart Analysis
- John Murphy's Chart Pattern Recognition
- John Murphy's Market Message
- MurphyExplainsMarketAnalysis-Intermarket Analysis
- MurphyExplainsMarketAnalysis-Visual Analysis
- StockCharts.com
- Technical Analysis of the Financial Markets
- The Visual Investor
- VectorVest, Inc.
- Executive Premier Workshop
- One-Day Options Course
- OptionsPro
- Retirement Income Workshop
- Sure-Fire Trading Systems (VectorVest, Inc.)
- Trading as a Business Workshop
- VectorVest 7 EOD
- VectorVest 7 RealTime/IntraDay
- VectorVest AutoTester
- VectorVest Educational Services
- VectorVest OnLine
- VectorVest Options Analyzer
- VectorVest ProGraphics v6.0
- VectorVest ProTrader 7
- VectorVest RealTime Derby Tool
- VectorVest Simulator
- VectorVest Variator
- VectorVest Watchdog
