HOT TOPICS LIST
- MACD
- Fibonacci
- RSI
- Gann
- ADXR
- Stochastics
- Volume
- Triangles
- Futures
- Cycles
- Volatility
- ZIGZAG
- MESA
- Retracement
- Aroon
INDICATORS LIST
LIST OF TOPICS
PRINT THIS ARTICLE
by Koos van der Merwe
Always anticipate the election cycle.
Position: Hold
Koos van der Merwe
Has been a technical analyst since 1969, and has worked as a futures and options trader with First Financial Futures in Johannesburg, South Africa.
PRINT THIS ARTICLE
CYCLES
The Election Nears
10/29/10 12:27:52 PMby Koos van der Merwe
Always anticipate the election cycle.
Position: Hold
| The American business cycle usually rises in the second year of a President's term of office. However, the rule is always to sell stocks when voters go to the polls. |

|
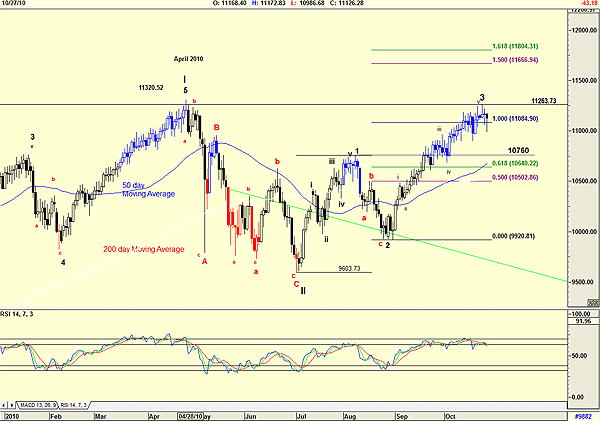
| FIGURE 1: DJIA. The DJIA is showing my preferred wave count. |
| Graphic provided by: AdvancedGET. |
| |
| Figure 1 is of the Dow Jones Industrial Average (DJIA) and shows my Elliott wave count as of October 28. On October 19, in my article, "The Dow Revisited," I wrote that I am expecting the DJIA to correct in a Wave IV. A look at the chart shows that Wave 3 of Wave III is greater than the length of Wave 1 of Wave III, suggesting that a correction is in order. With Wave 2 of Wave III, a complicated wave, Wave 4 of Wave III, should be a simple wave and should not fall below 10760, the high of Wave 1 of Wave III. If it does, then I will have to do a complete recount of my Elliott wave. The relative strength index (RSI) shown is confirming the correction. What does concern me is the time it will take to complete. Hopefully it will be fast, as the best months of any year are November to March. In the past, I have also written about a man I knew in the 1970s named Paget, who had some interesting theories on cycles, as well as my good friend, Franco du Toit, who worked successfully with Gann cycles. Figures 2 and 3 show their timing cycles for the DJIA. |

|
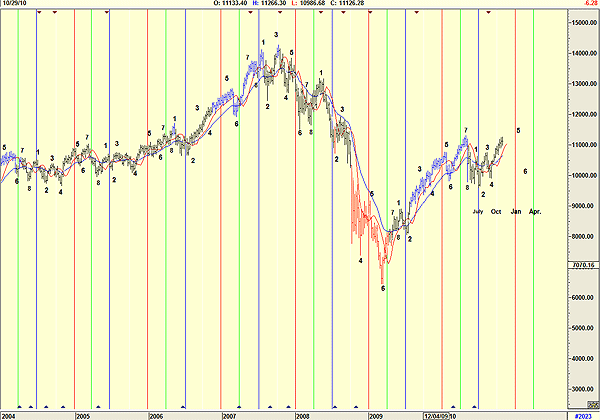
| FIGURE 2: DJIA, WEEKLY. Here's a chart of the DJIA showing Paget's cycle count. |
| Graphic provided by: AdvancedGET. |
| |
| Figure 2 is a weekly chart of the DJIA showing Paget's cycle count. He believed that each year should be divided up into quarterly cycles, and an index would always repeat its cycle pattern as the years progress. I have colored each quarter with a different shade as shown. I have also started the count on the low made on October 2, 1974 (not shown), and repeated it over the years. This gives me the one up and the two down always around July of each year. The chart is suggesting that the DJIA should rise into the 5 count of January 2011 to be followed by the count 6 down before April. |

|
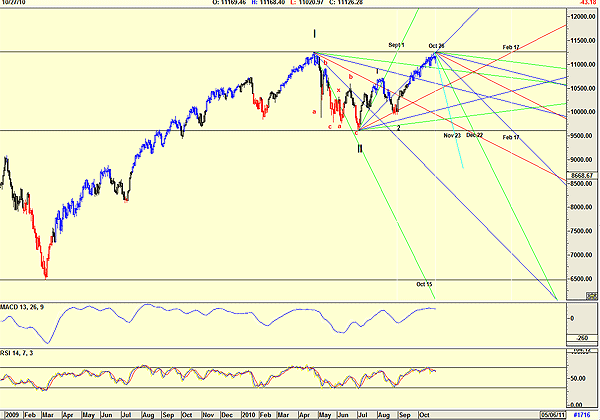
| FIGURE 3: DJIA, DAILY. Here's a chart of the DJIA with Gann fans. |
| Graphic provided by: AdvancedGET. |
| |
| Figure 3 is Franco's Gann fan chart. The Gann fan parameters are determined by looking at a long-term chart of the DJIA. One can become familiar with the strategy by reading my article in STOCKS & COMMODITIES in the August 2010 issue, "Gann And The Time Factor." The fan without changing the parameters is then projected from new highs and lows, and the time taken is where the angles of the fan crosses the horizontal from the previous high/low, as shown on the chart. This suggests that we could see a high on October 26. Assuming that this high is correct, and projecting a Gann fan from this point, the bottom of the wave 4 correction could be November 23. If the high is later than October 26, obviously the fan will move, as will the date. For now, I am expecting a wave 4 of Wave III correction in the DJIA, possibly lasting until November 23 if the high of October 26 is correct. This is because of the elections season in the US at the moment. Hopefully I am wrong, and the DJIA will continue to rise with a minor correction, as suggested by Paget's weekly cycle count. In any case, caution at the moment is on the cards, but a correction does allow a further buying opportunity. |
Has been a technical analyst since 1969, and has worked as a futures and options trader with First Financial Futures in Johannesburg, South Africa.
| Address: | 3256 West 24th Ave |
| Vancouver, BC | |
| Phone # for sales: | 6042634214 |
| E-mail address: | petroosp@gmail.com |
Click here for more information about our publications!
Comments
Date: 11/04/10Rank: 5Comment:

Request Information From Our Sponsors
- StockCharts.com, Inc.
- Candle Patterns
- Candlestick Charting Explained
- Intermarket Technical Analysis
- John Murphy on Chart Analysis
- John Murphy's Chart Pattern Recognition
- John Murphy's Market Message
- MurphyExplainsMarketAnalysis-Intermarket Analysis
- MurphyExplainsMarketAnalysis-Visual Analysis
- StockCharts.com
- Technical Analysis of the Financial Markets
- The Visual Investor
- VectorVest, Inc.
- Executive Premier Workshop
- One-Day Options Course
- OptionsPro
- Retirement Income Workshop
- Sure-Fire Trading Systems (VectorVest, Inc.)
- Trading as a Business Workshop
- VectorVest 7 EOD
- VectorVest 7 RealTime/IntraDay
- VectorVest AutoTester
- VectorVest Educational Services
- VectorVest OnLine
- VectorVest Options Analyzer
- VectorVest ProGraphics v6.0
- VectorVest ProTrader 7
- VectorVest RealTime Derby Tool
- VectorVest Simulator
- VectorVest Variator
- VectorVest Watchdog
